What does the data submitted through FotoFauna tell us about wildlife in the Sky Island region? Use the interactive dashboard embedded below (also viewable in full screen) to explore results from this project by species and polygon — and see what kind of wildlife have been detected near you. If you have questions, feel free to email our Wildlife Program Manager Eamon Harrity.
- FotoFauna Home
- Getting Started
- Project Results & Dashboard
- Lending Libraries
- FotoFauna FAQs
- Species Gallery
- Species ID Resources
- Support a FotoFauna Camera
The Data So Far
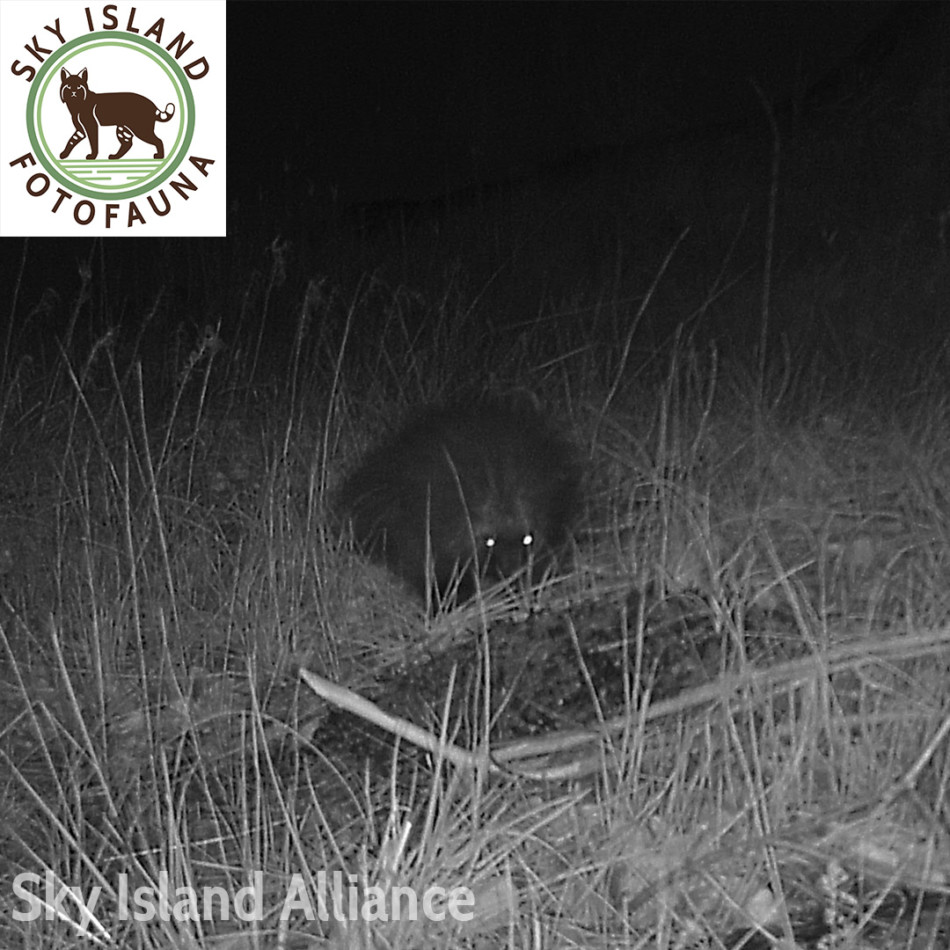
Since launching the FotoFauna project in October 2020, volunteers and partners have contributed more than 4,750 checklists from hundreds of unique locations in the U.S. and Mexico. Cameras managed by Sky Island Alliance and collaborators have also contributed roughly 5,000 checklists to bring our FotoFauna database to nearly 9,500 monthly records of wildlife occurrence. These data provide a window for us to look at the diversity and distribution of mammals and select bird and reptile species in the Sky Island region.
Each checklist confirms the presence or absence during a given month of 43 species (plus other birds, rodents, and reptiles) at a trail camera location. By expanding this network of cameras across the region and collecting more checklists over time, communities in this region — from Tucson, Arizona, to Hermosillo, Mexico — can deepen their understanding of the wildlife present in their neighborhoods and use this info to guide local conservation actions.
With more than five years of data in hand, we now know:
- The most common species on monthly checklists are:
- White-tailed deer (Odocoileus virginianus) with 4,673 records
- Coyote (Canis latrans) with 4,478 records
- Javelina (Pecari tajacu) with 4,249 records
- Cottontails (Sylvilagus spp., both desert and Holzner’s combined) with 3,419 records
- Bobcat (Lynx rufus) with 2,981 records
- Gray fox (Urocyon cinereoargenteus) with 2,802 records
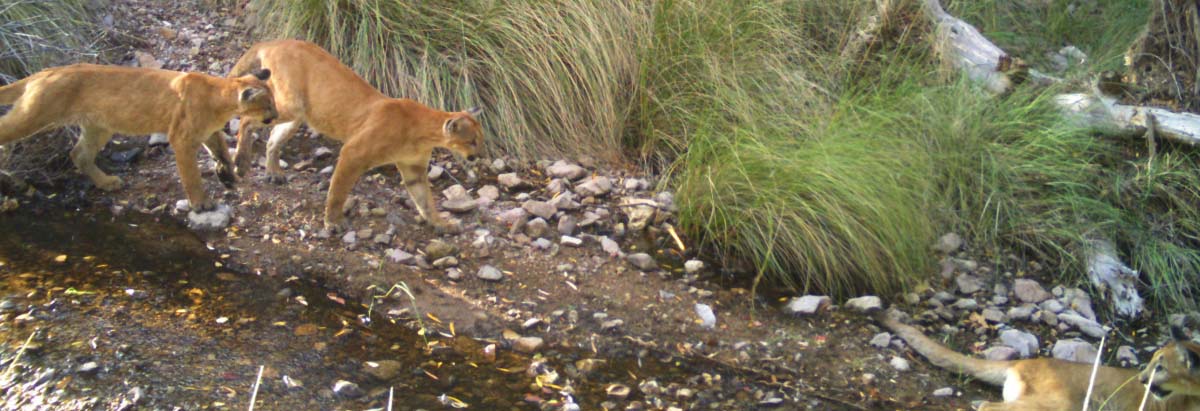
- All four cat species — jaguar, mountain lion, ocelot, and bobcat — have now been detected by at least one camera in our FotoFauna network. To protect ocelots and jaguars, we do not present records of these cats in the interactive charts or maps above but instead have created a separate map showing the mountain ranges where they have been detected on FotoFauna cameras.
- Within the greater Tucson area, FotoFauna cameras have detected 28 wildlife species, including badgers, ringtails, and all four kinds of Sky Island skunks.
- The borderlands between the Patagonia and Huachuca mountains is one of the most diverse areas in the FotoFauna region.
- Water is life! Cameras near water sources average greater species diversity than cameras not near water (June 2025).
Dashboard Guide
We created the interactive dashboard above by summarizing all checklists from participating cameras into 6-mile polygons. Within each polygon, we count the number of checklists, the number of cameras, and the number of species. This allows us to protect the privacy of participants and animals as well as efficiently display data across the region.
Here are a few tips for exploring the FotoFauna Dashboard (also viewable in full screen).
- The darker the color of the polygon, the greater the species diversity.
- View the map legend or change the basemap by clicking the icons in the upper right corner of the map pane.
- Zoom into specific locations on the map by hovering over the map and scrolling down (scroll up to zoom out).
- Click and drag the map to move the field of view.
- Click on the Sky Island FotoFauna icon in the lower right corner to view a gallery of our favorite images! This gallery is searchable by species and is updated regularly.
- Expand the data figures around the map by clicking on the upper right corner of each panel (the circle with four arrows pointing outwards).
To View Data by Species
The bar chart under the map shows the total monthly checklists recorded for each of the FotoFauna species. The three charts on the left side of the screen show the 10 polygons with the most detections for javelina, American black bear, and American badger. Click on the columns in the select species charts to zoom to areas with the greatest number of detections for each species.
To View Data by Polygon
Click on a polygon to see the number of species recorded, the number of cameras collecting data, and the date of the most recent submission. We summarize data by these polygons to protect the privacy of our volunteers and animals.
Most Wanted Species
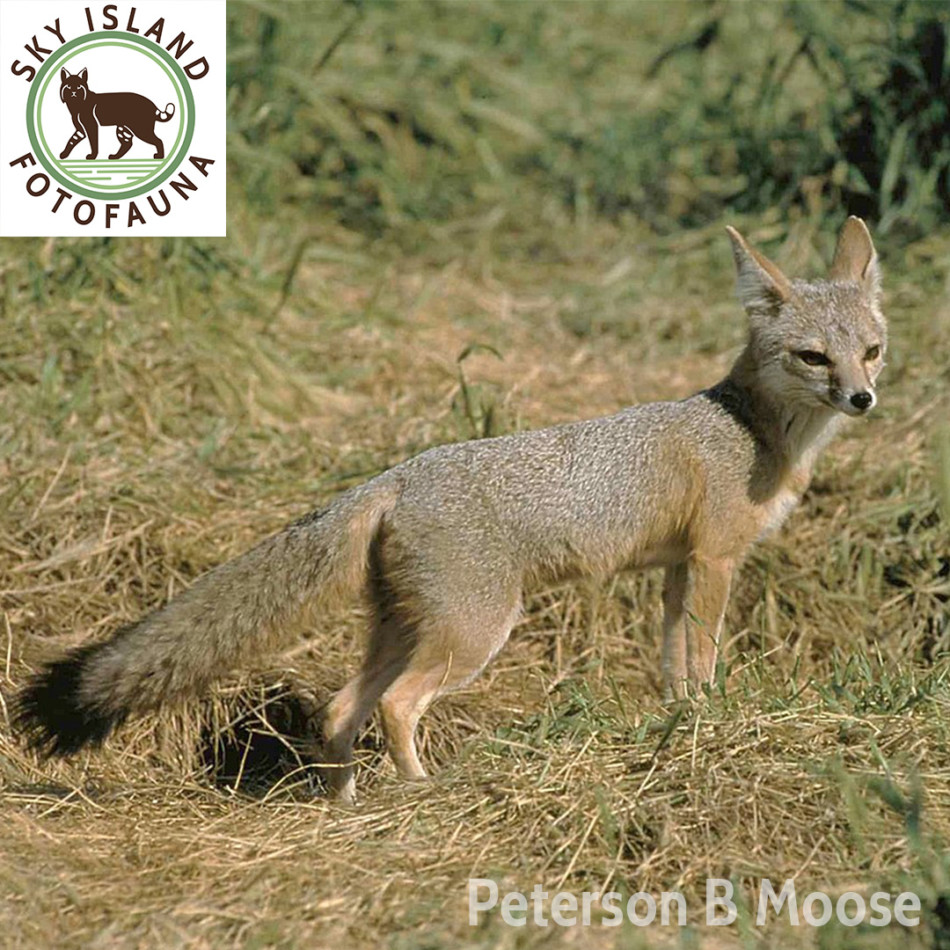
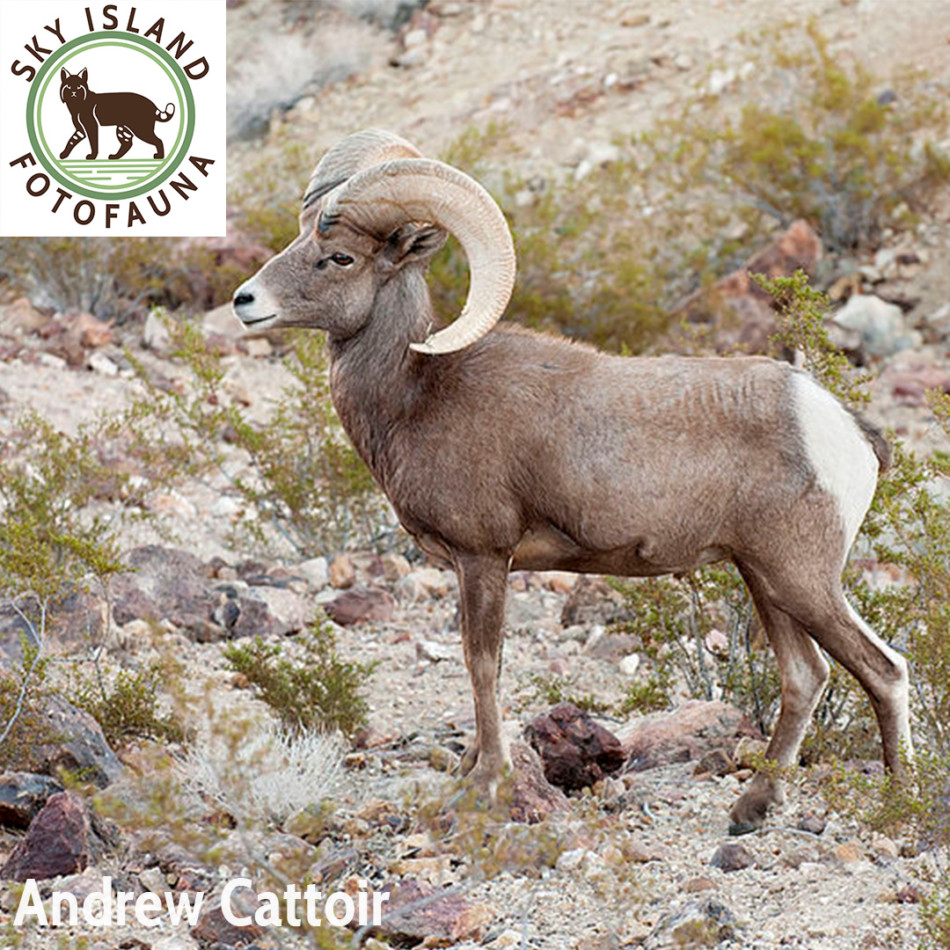
Here are the species we have not yet detected through the Sky Island FotoFauna network. If you have seen any of these species in your area, consider joining FotoFauna to add your data to our dashboard!