Did you know that we can identify fossil fuel emissions in the air by sampling annual plants and counting cars? Knowing where greenhouse gases are and at what concentrations can help policymakers fight climate change. All major cities in Arizona have developed action plans to reduce greenhouse gases, but they still lack quality data regarding carbon dioxide sources and the ability to monitor how well actions work. You can help!
This spring, Sky Island Alliance is partnering again with Northern Arizona University’s ACE Isotope Lab, Arizona State University’s Southwest Urban Corridor Integrated Field Lab, and Desert Botanical Garden in Phoenix to measure fossil fuel levels in Arizona’s three biggest cities. For this particular collaboration, our role is to contribute data specifically from Tucson. What we need are volunteers to help sample different places around town to understand which areas have the highest emissions.
Our first activity involves collecting vehicle data around Tucson to inform models tracking fossil fuel emissions across Arizona. We’ll be helping count traffic using the Hestia App. Hestia is a modeling approach used by Northern Arizona University that shows fossil fuel sources across cities at a highly precise scale. The data will allow city planners to identify emissions hotspots and monitor progress toward climate actions over time.
This is important since on-road activity is one of the largest sources of greenhouse gases and local pollution in large cities. However, for Hestia to run more effectively, more info is needed about how different types of vehicles are distributed at various road locations. We need volunteers to help gather this data. To get started, simply follow the steps below.
On your smartphone, go to the App Store, search “Hestia Traffic,” and download the app.
Once downloaded, follow the prompts to create your account and allow location permission while using the app. The app has a short intro video, training video, and quiz about vehicle types that will have you ready to count traffic once completed.
Target Locations: The project has established target locations across the city where data will be most valuable. Navigate to these target locations on the app and do your count as close to the point as possible. Be sure to count in a safe location — on the sidewalk or parked legally where you can see both sides of the street.
Non-Target Locations: If you are unable to access a target location or want to help us broaden our data collection around Tucson, you can record counts on any street by clicking the Preform Counts button at the bottom of the home screen. Follow the prompts on screen to begin counting.
Don’t count anywhere you feel unsafe for any reason. Please let SIA staff know if you couldn’t count at a target location due to concerns.
Count only on the side of the road. Park legally and stand safely. You can of course stay in your vehicle to count if you’re parked and can see traffic on both sides of the street. Business parking lots that face the road are ideal.
If someone asks what you’re doing, you could reply simply “counting traffic” or “assisting university research on climate change.”
Have questions? Email SIA Program Director Emily Burns to discuss more.
Our second volunteer opportunity this spring involves collecting certain invasive annual plants around Tucson, so we can send them off to a lab for tissue analysis. When fossil fuels are burned in our communities, they leave an imprint on atmospheric carbon dioxide. Plants record their level of fossil fuel exposure in the radiocarbon content of their stems, leaves, and flowers. For annual plants — i.e. ones that will complete their entire lifecycle this spring — their tissues will have lower radiocarbon signatures in areas with higher fossil fuel emissions.
Learn more about how to help below. You can also watch our 2024 virtual training. We’ll be collecting plants throughout March and April, and after this training you’ll be ready to volunteer with confidence. You can also jump right in and follow the guide below. Either way, you’ll need to schedule a time to pick up sample envelopes and an assignment from the SIA office. Contact Emily Burns to arrange a time. Generally, our staff will be available on Wednesdays from 1-4 p.m. and Thursdays from 9 a.m. to noon.
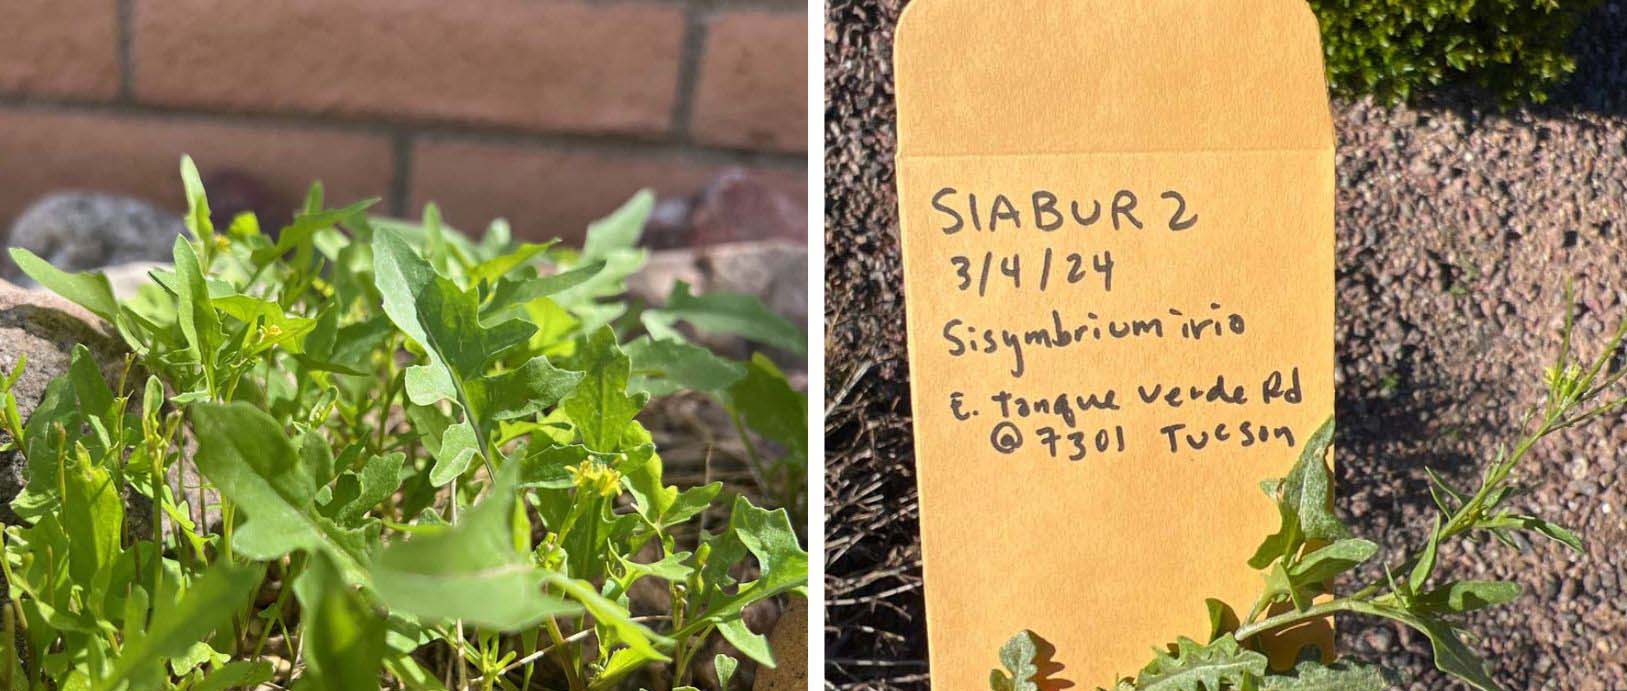
Locate an invasive annual plant in the greater Tucson area. We recommend looking for London rocket(Sisumbrium irio) right now as it’s sporting yellow flowers all around the city. (Here’s a full list of annual plants the project will accept.)
Label your paper collection envelope with the following info:
Individual ID code — this will be SIA + the first three letters of your last name + 1, 2, 3, etc. to show the sequence of your samples. (For example, my first three samples will be labeled SIABET1, SIABET2, SIABET3).
Date
Scientific name of the plant
Brief description of location
Open the iNaturalist app on your smartphone:
Click Observe.
Click on Camera and take a photo of the annual plant you found. Click the + at the top of the screen to add a second photo with the labeled collection envelope visible in the photo.
Click What did you see? Select the plant you found based on iNaturalist’s suggestions.
Click on the Location and verify that it’s accurate. If not, move the crosshairs to your location and click Save.
In the Notes section of the observation, write your Individual ID code (example: SIABET1).
Click Share to upload your sample to iNaturalist.
Cut the plant sample, taking at least one stem segment with leaves the length of your index finger. If you pulled the invasive out by the roots, discard the roots and soil. Put the stem sample into a collection envelope.
Repeat for any other plant samples, one per envelope.
Return your samples to the SIA office. Contact Emily Burns to arrange a time. Generally, SIA staff will be available on Wednesdays from 1-4 p.m. and Thursdays from 9 a.m. to noon.
We’re focusing on collecting annual plants because their carbon signature only reflects fossil fuel emissions this spring season. Since they’ve only just sprouted, they are able to provide a reliable, specific time period of measurement for the study: what’s in the air right now. A longer-lived plant would integrate emissions over the span of years, and that would be a harder signal to interpret.
This science behind this project and radiocarbon dating would work just as well with native plants. But we’re focusing on invasive plants because it’s helpful to remove them and leave the native wildflowers for the pollinators.
Carbon-14, also known as radiocarbon, is a variant isotope of carbon that’s found in the atmosphere naturally. So plants growing with exposure to normal clean air will have an expected amount of this isotope in their tissues. When plants get a lot of fossil fuel emission exposure, however, that changes the chemical composition of the surrounding air. Fossil fuels are also carbon based but do not contain the specific isotope carbon-14. That means that in polluted areas, the amount of carbon-14 in the air is diluted. And that’s recorded in plant tissues as a lower radiocarbon signature. An easy way to remember this dynamic is that more pollution = less radiocarbon.