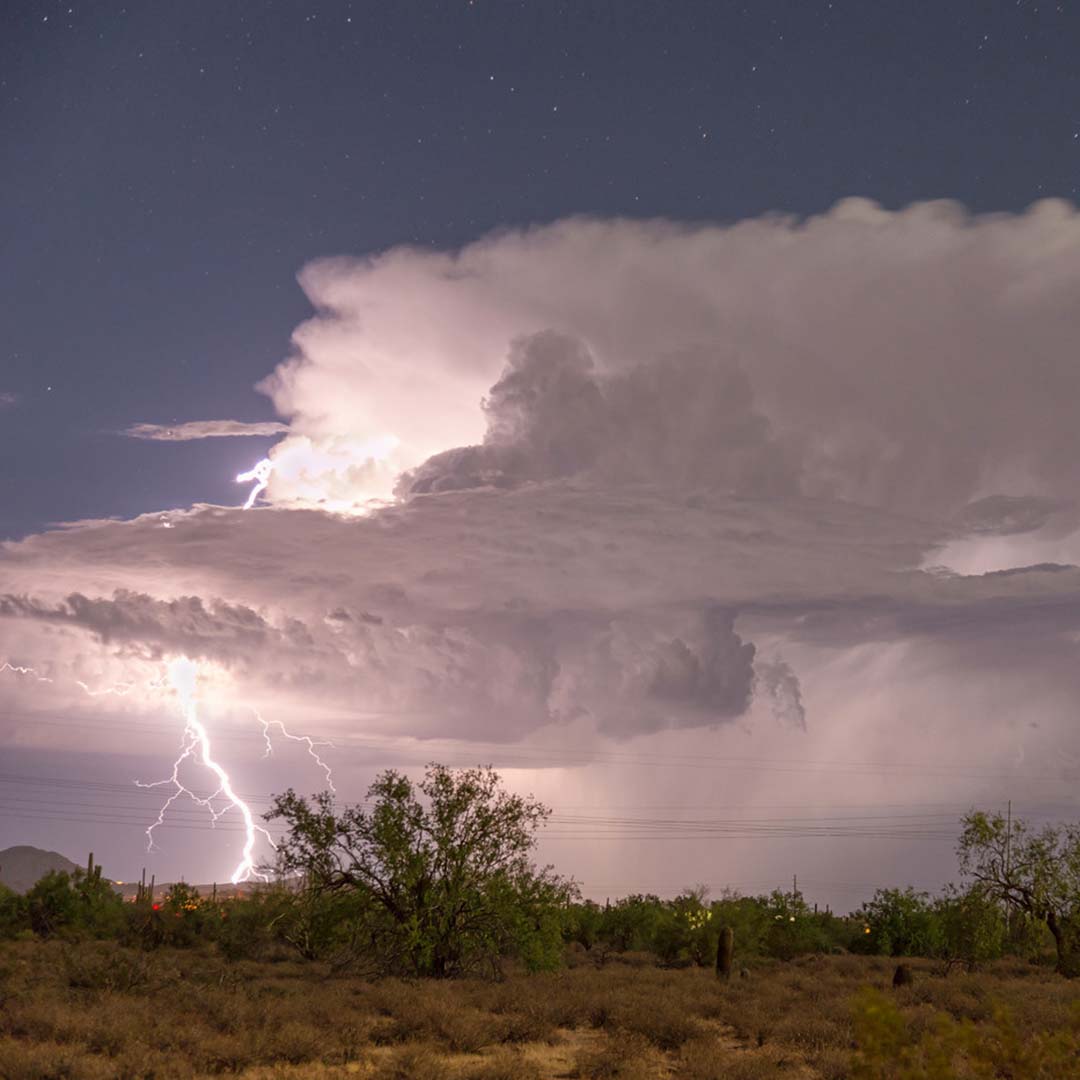
 The monsoon is imminent here in Tucson, Arizona, and it’s already started further south in Sonora! I grew up in Tucson, and it was an early interest in how the monsoon worked that led me to study climate science and eventually conservation. I’m so excited to share with you many of my favorite online sources for the monsoon to understand what’s happening on a daily and seasonal basis.
One thing you might be wondering is why forecasts seem so variable. One reason the monsoon is so hard to predict is because we have a lot of complicated terrain in the Sky Islands. In weather and climate models, our mountains are too small to be “resolved” (i.e., visible). But our mountains are critical for initiating cloud and thunderstorm formation — what’s known as “convection.” Models are run and updated every few hours during the monsoon as actual weather conditions shift and new measurements come in. What may seem like a minor update can completely change the day’s forecast. Add to the mix the role of chaos theory, and you understand why the monsoon is the most exciting time of year in the Sky Islands!
Here are some sites I check on a daily or weekly basis to track what’s happening with the monsoon.
Blogs
Madweather — for the early risers who want to get an idea of how the day might shape up, Bob Maddox usually posts a forecast early in the morning. He’s a retired weather forecaster with decades of experience, so he looks at the model output with a critical eye and assesses whether we’ll have rain.
Arizona WRF Discussion — this great blog provides an almost daily assessment of model output. It can get pretty technical, but even just scrolling through and looking at the forecasted rainfall maps for Day 1 (today) and Day 2 (tomorrow) can be helpful. It also does a great job assessing how the models did for the previous day, which makes it possible to learn about the perfect storm of ingredients needed to make it rain.
Visuals and Graphics


Monsoon Videos — want to see a haboob (dust cloud) sweep across the desert? Or see what a microburst looks like from afar? Check out Mike Olbinksi’s informative and beautiful videos.
National Weather Service’s Monsoon Tracker — this site provides the best overall summary of the monsoon in southern Arizona. You can see how the season is coming along with rainfall at a number of major cities, and you can see a graph of the dewpoint over time. The dewpoint is a measurement of how much water is available in the air — that moisture drives thunderstorms to form. There are lots of other stats and info too. Check out all the tabs to learn more, for instance, about the average start date of the monsoon, how monsoons work, etc.
Best Summary Diagrams — for rainfall, temperature, and other variables across Arizona and New Mexico, check out this page by Mike Crimmins. Click on any point on the map to see the accumulated rainfall during the monsoon at that site.
NOAA’s Storm Prediction Center — have you ever wondered what those giant mylar weather balloons are for? You can actually look up their measurements every 12 hours across North America at this site. For help interpreting, click here. These diagrams can be confusing, but the balloons give us precise measurements for wind, moisture, and temperature that can be used in forecasts.
Radar Catnip — for folks who really like looking at radar, check out the University of Arizona’s raw “downscaled” model output. Scientists take this climate and weather model output and run the models on a smaller scale that actually shows all our mountains properly and predicts precisely where storms might form that day. I like AZRadar the best; you can rock forward or back on any of the animations to see where the models think it will rain that day.
Try Your Hand at Forecasting
Southwest Monsoon Fantasy Forecast — the University of Arizona’s Institutes for Resilience has a super fun game you can participate in for the monsoon! You can put in a forecast for the major cities across Arizona and New Mexico. I don’t know what the prize is this year, but it’s entertaining to learn more about the monsoon and then enter your own prediction.
In the Moment
And of course, the most exciting part of the monsoon is when it’s raining on us! I tend to switch over to my smartphone at this point. Here are three apps I know of and recommend.
- Meteoblue (Android / Apple / Desktop) — this app is great for forecasts of the next couple days to the next week or so. My favorite part is the “meteogram,” which compares different model outputs for rain amount and rain rate.
- MyRadar (Android / Apple) — great, simple radar interface. But there are many trackers out there, so feel free to explore.
- My Lightning Tracker (Android / Apple) — this app can send you notifications when lightning is within a given distance of your position. I find this helpful for field safety (mine is set to 10 miles). In the pro version, you can set the notification to make a thunder sound if lightning strikes nearby! A good alternative is this online source if you don’t want to have an app with ads or pay for the pro version.
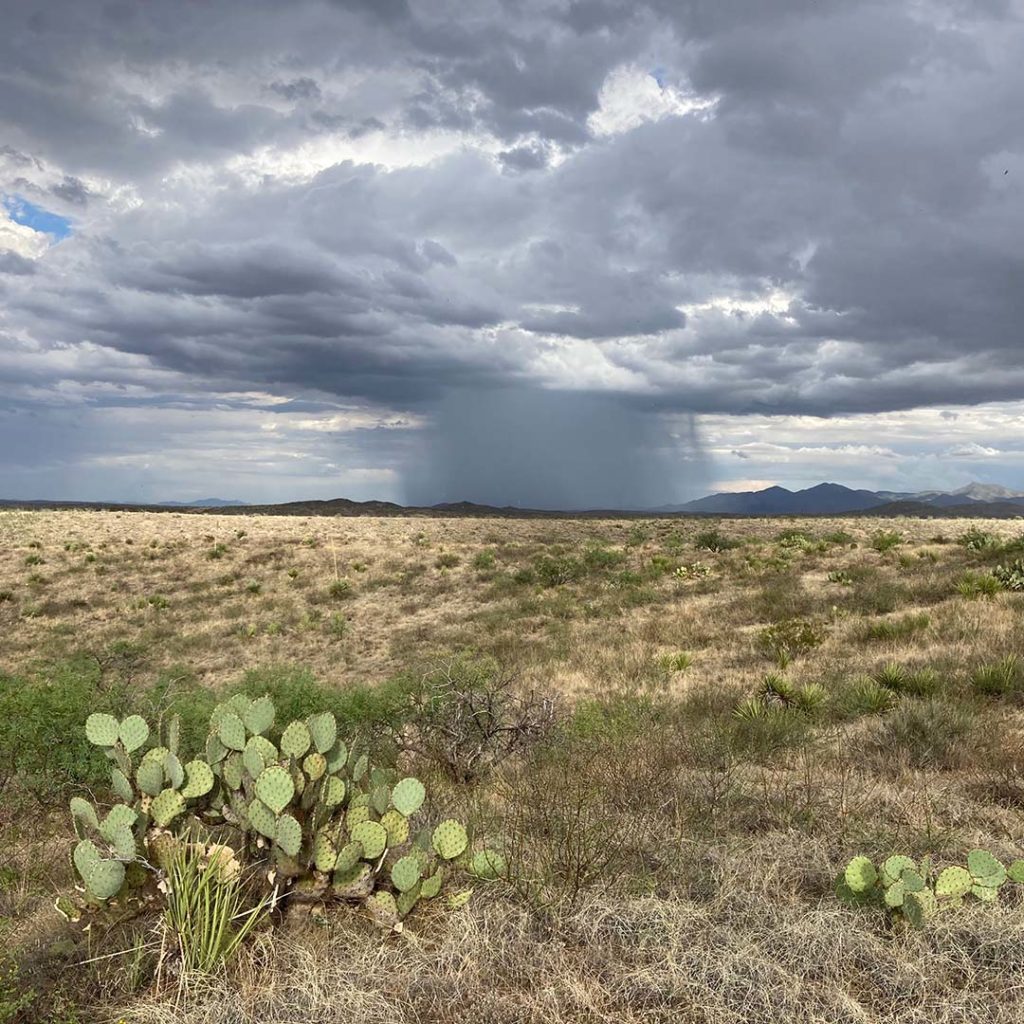
Good luck and have fun tracking the monsoon! Watching the storms form is a beautiful thing — and it’s also one of the best times of year to see desert blooms and wildlife.
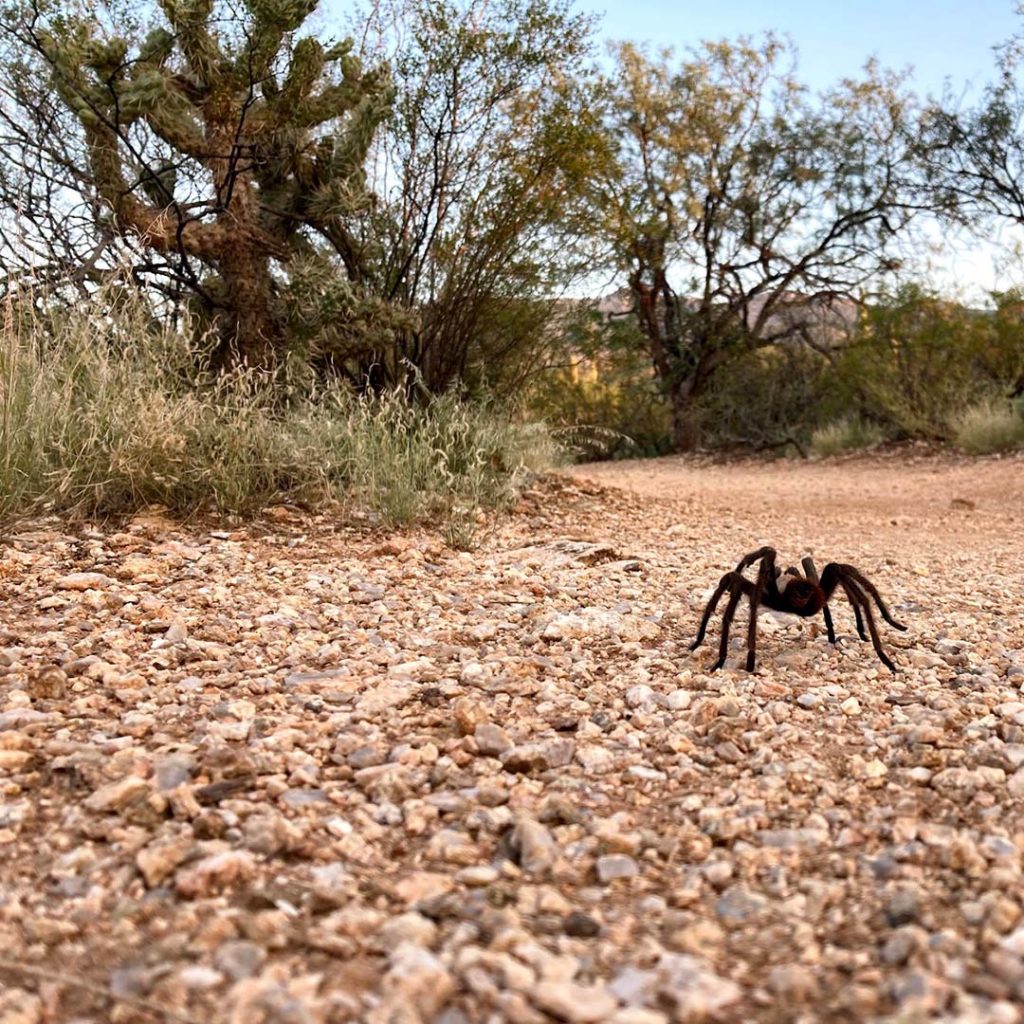
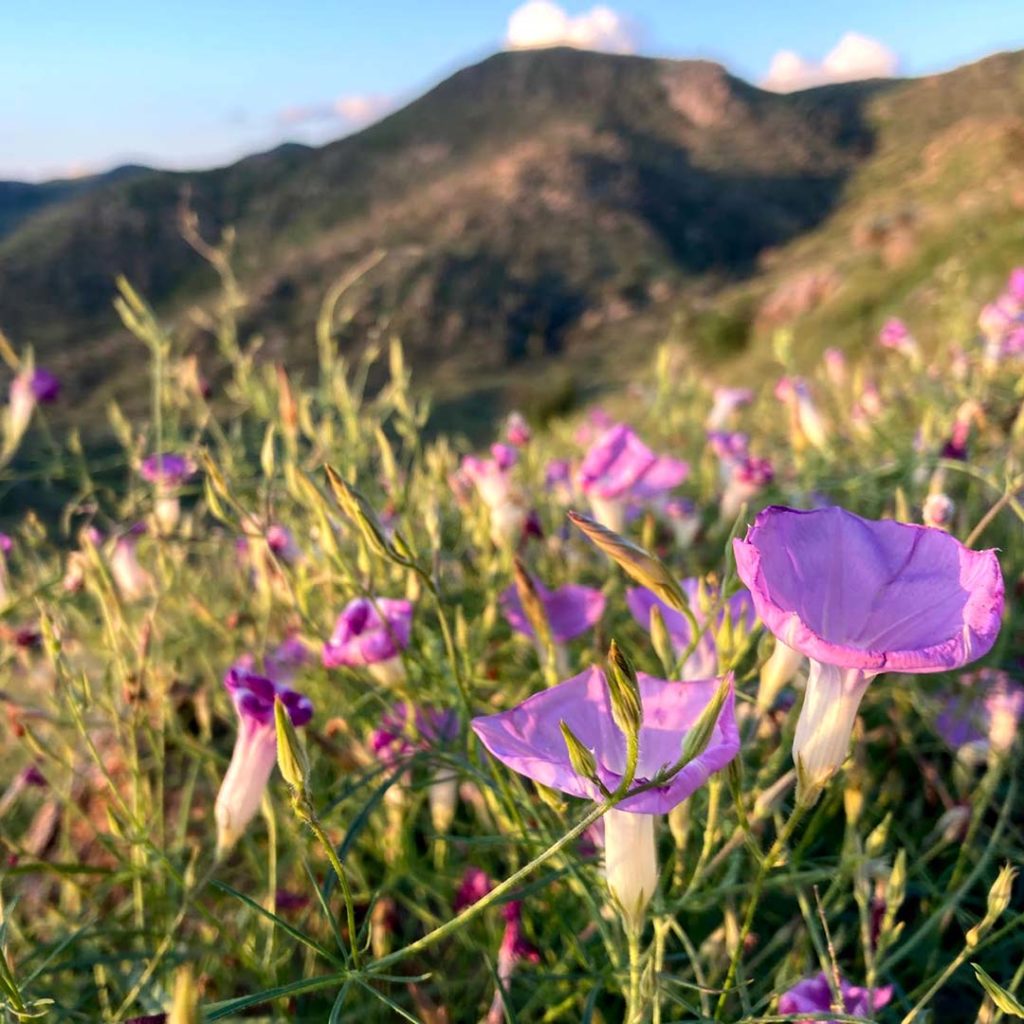
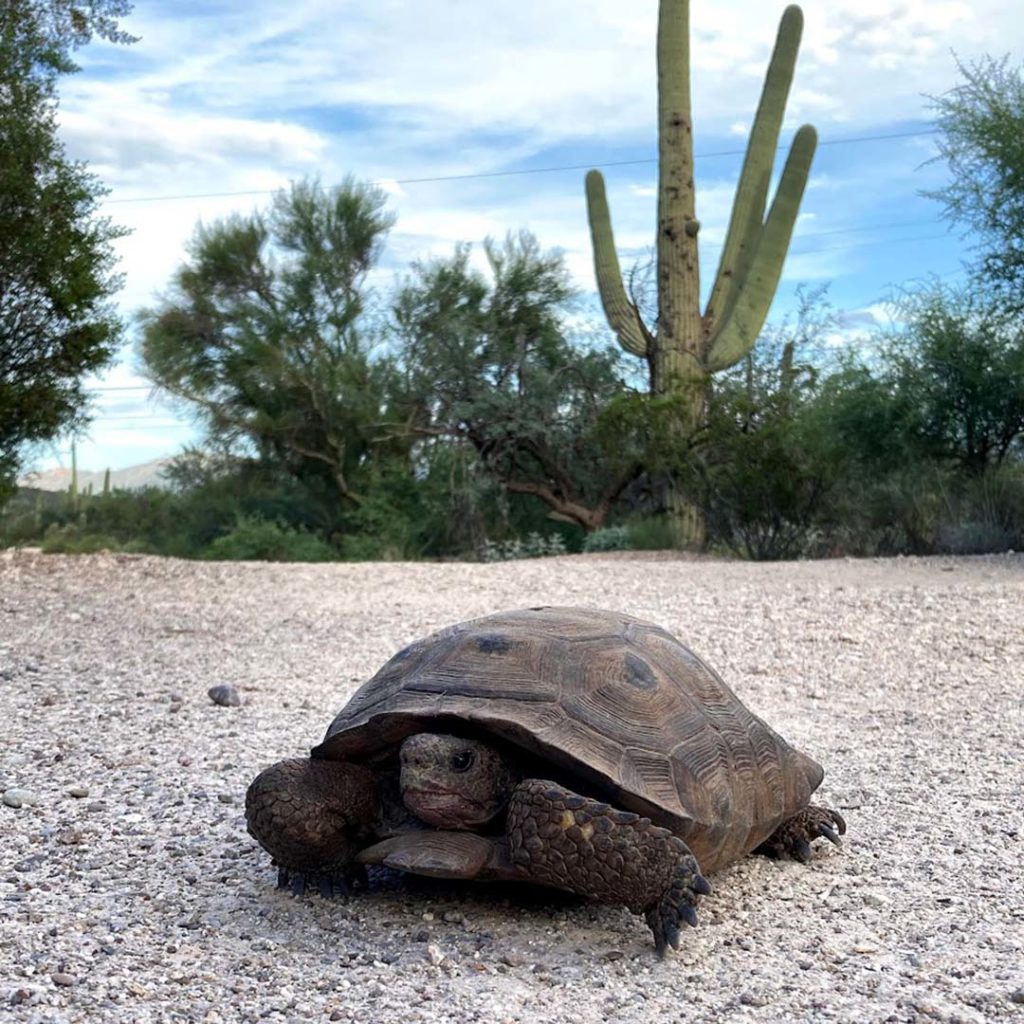
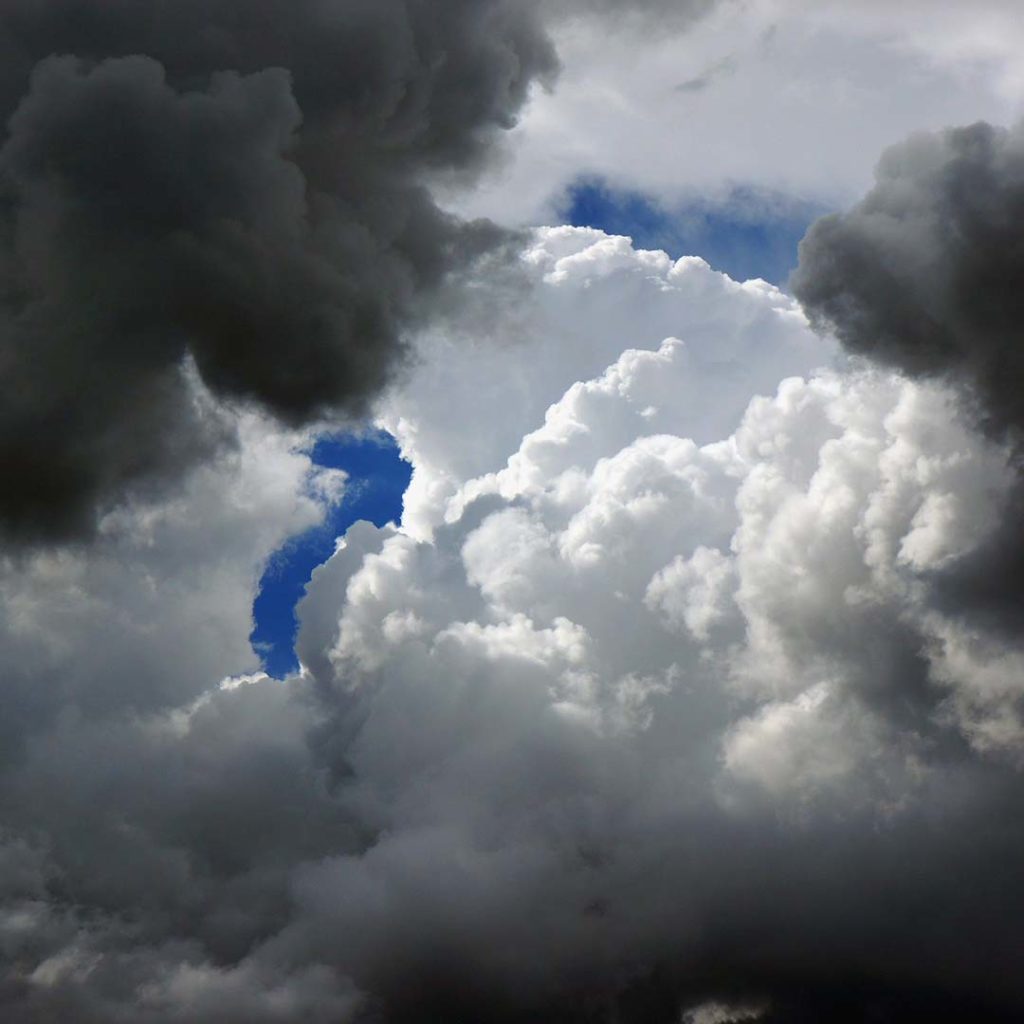
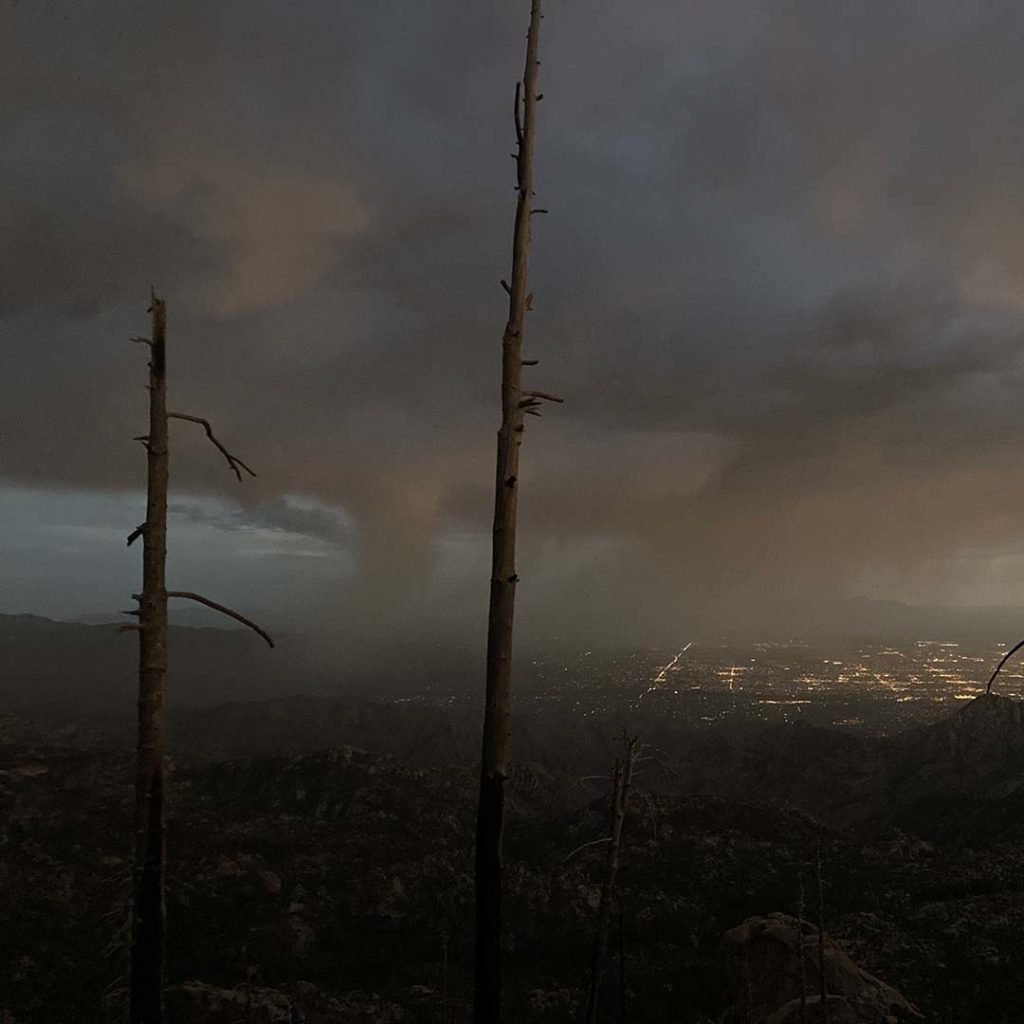
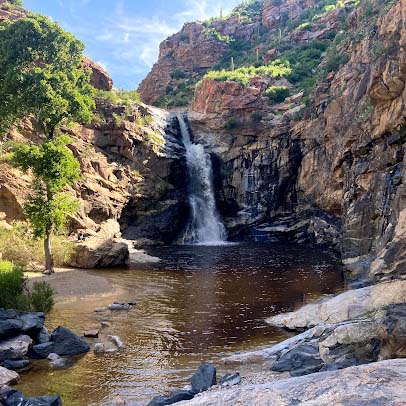
Photo Credits: Monsoon lightning by Bo Insogna/Flickr; monsoon clouds by Regan Vercruysee/Flickr; virga over Tucson by Rick Mick/SIA; Tanque Verde Falls by Rick Mick/SIA; haboob over Phoenix by SD Anderson/Flickr; monsoon microburst by Rick Mick/SIA; weather balloon by COD Newsroom/Flickr; tarantula by Rick Mick/SIA; morning glories by Rick Mick/SIA; desert tortoise by Rick Mick/SIA.