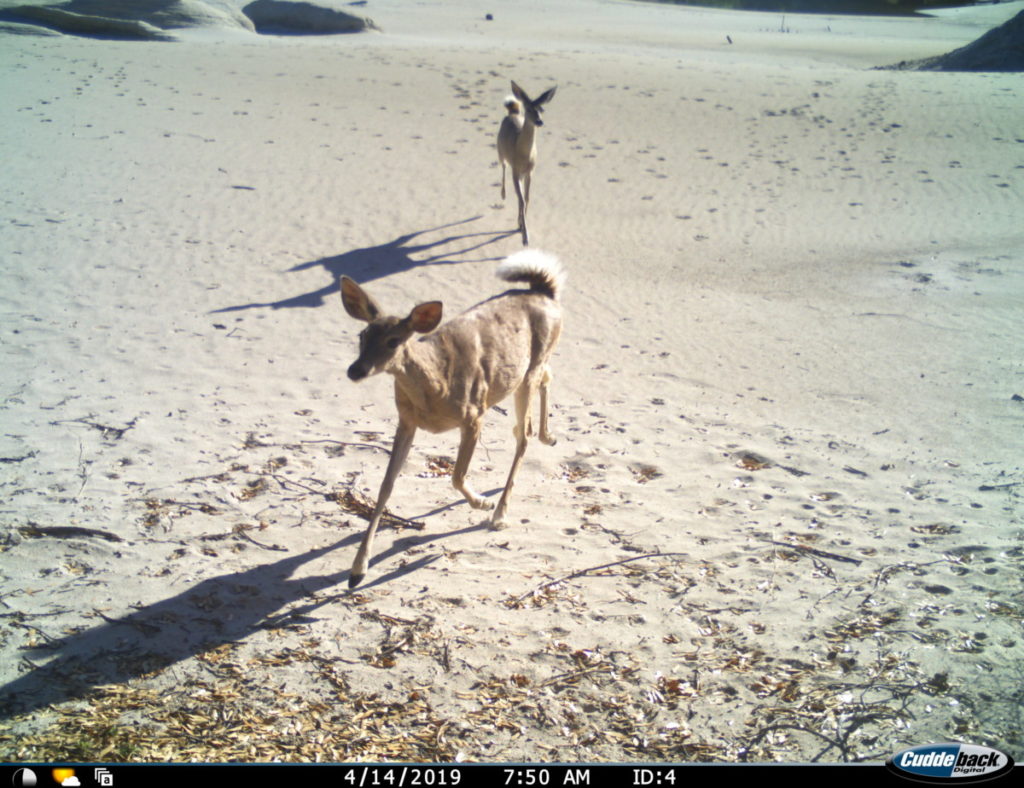
Currently I am wrapping up an analysis of all the wildlife camera data from our Wildlife Linkages Monitoring Program. The data analyzed here is from a combination of cameras that are owned by SIA as well as the personal cameras from volunteers and partner organizations. All these cameras are checked and operated by volunteers, and without them none of this would have been possible. Thank you all for you hard work and enjoy this preview of the results.
-Meagan Bethel, Conservation Coordinator
We cannot analyze the data just on the number of photos the camera takes. One individual animal can stand in front of a camera and take hundreds of photos, thus skewing the data. So, to help alleviate this bias, three-burst photos were narrowed down to one. Then multiple photos of the same species taken within 30 minutes of each were removed to have one photo of that species in that time frame. Additionally, humans were removed so we can focus on the wildlife activity. However human presence was recorded and will be analyzed later if necessary. Going forward in this report, all wildlife data will be labeled as Number of Detections, meaning the number of wildlife photos of that species that are more than 30 minutes apart.
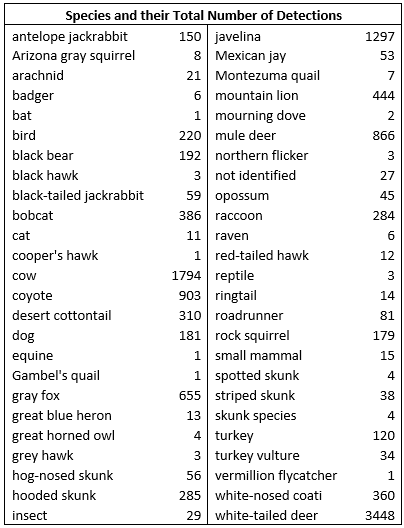
Table 1 The total number of species detections combined for all cameras. White-tailed deer were the most detected species on all the wildlife camera detections. Followed by cattle, domestic animals unaccompanied by humans are included as they do affect the landscape the same as wildlife.
Species Accumulation Curve

Figure 1 Species Accumulation Curve for all cameras that were contributing data from July 2017 to July 2019. Each point represents one wildlife camera and shows the month where it reached the maximum number of species detected on that camera. Most of the cameras reached maximum species richness around 20 months of operation.
There are outliers in this graph, but the trendline shows that after 30 months of operation, most of the species would have been captured. This is a good indication on how much time SIA should leave our cameras out in the field. If can determine that 24 months is an adequate time to document the majority of the species on that site, we can then relocate the camera to a new area. This will allow is to cover a larger land area with a smaller number of cameras. Long term monitoring is useful and needed to document the changes over time, but if our goal is to record the wildlife living in as many areas as possible moving cameras to new sites will be a useful approach in wildlife monitoring for SIA.
Habitat Type Comparisons
The graphs below compare the average number of detections by habitats for a various combination of species. Averages were taken because there was an unequal number of cameras in each habitat type. This allows for better comparison.
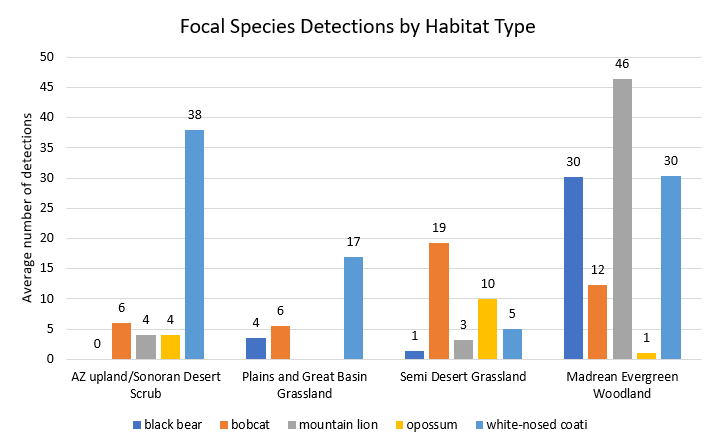
Figure 2 Average number of detections of SIA focal species by habitat type
This graph compares the number of detections by habitat type of the SIA focal species detected on the cameras. The focal species were selected due to their limited range in the Sky Island region and their need for large open spaces to thrive. The Madrean Evergreen Woodland had the highest overall number of detections, this is the favored habitat for these species so it’s not unexpected. The Semi Desert Grassland had the highest detections of both bobcat and opossums. While the AZ upland/Desert Scrub had the highest average detections of coati. This location however is set along a riparian area and might not be totally representative of the surrounding habitat.
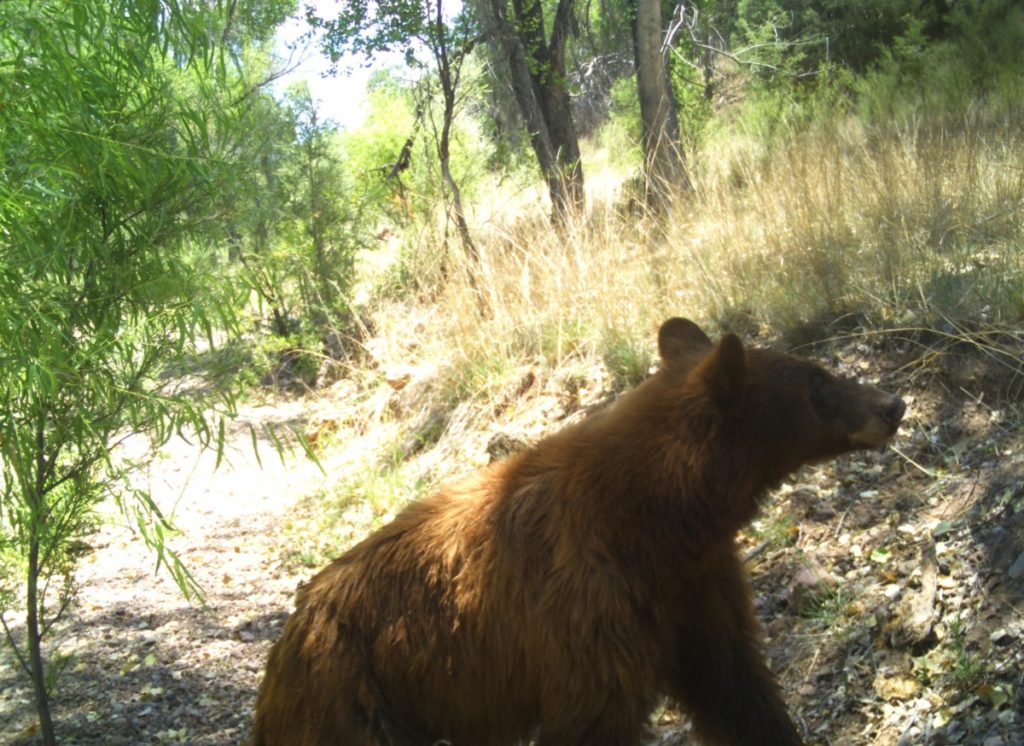
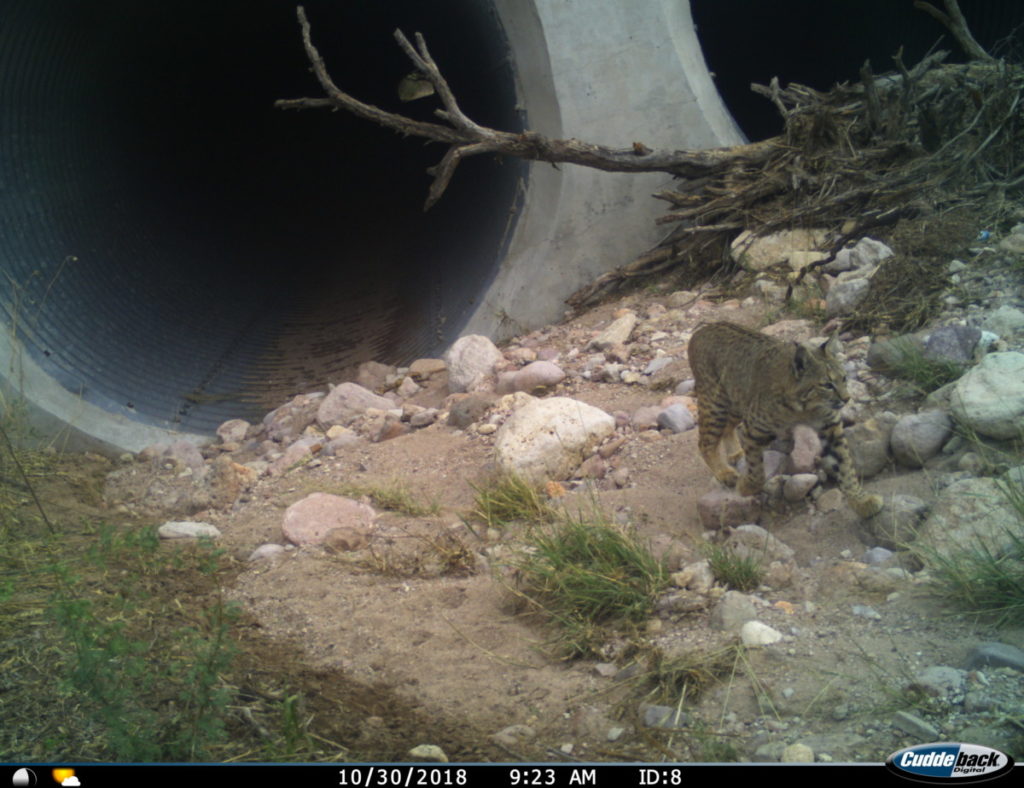
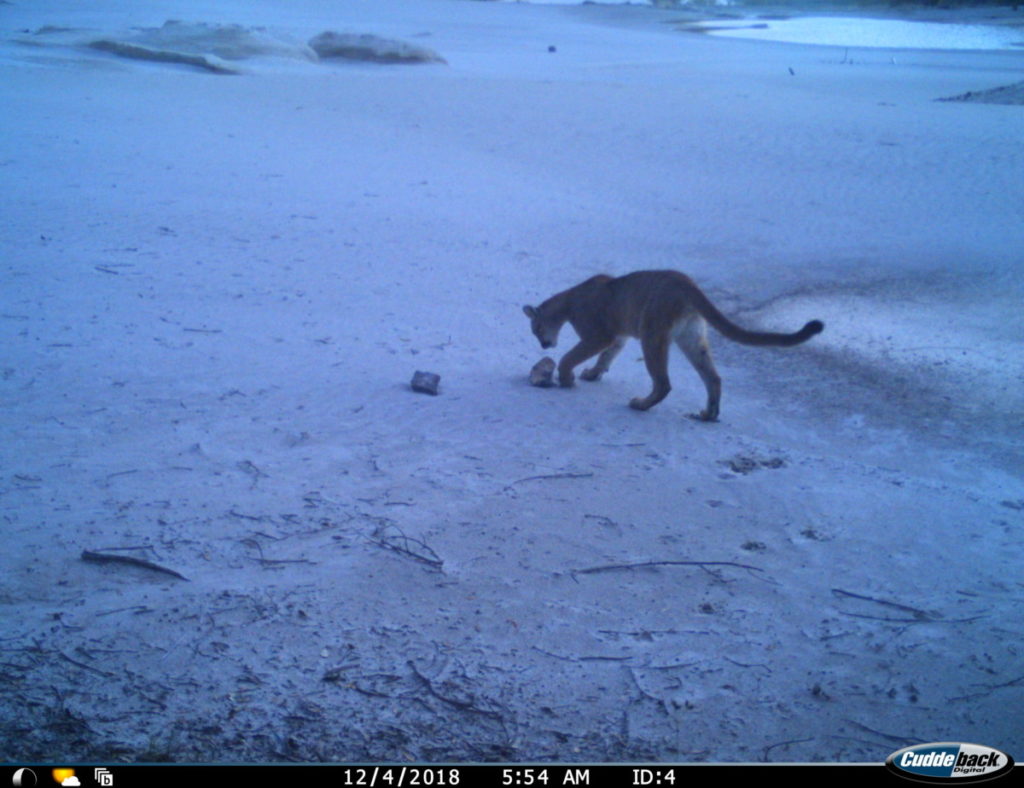
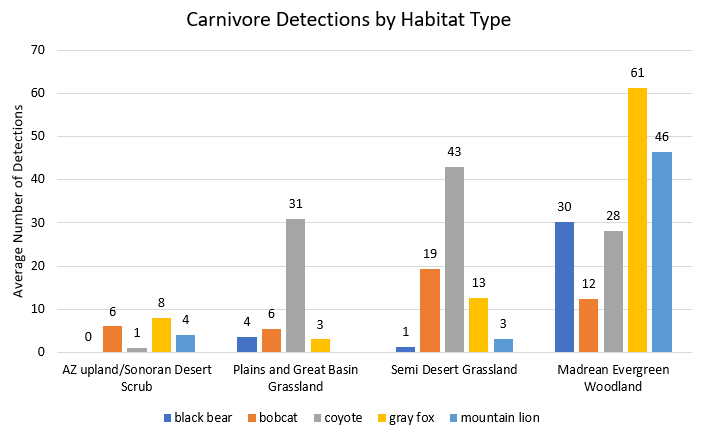
Figure 3 Average number of detections of carnivores by habitat type.
The above species are the larger carnivores detected on the cameras, smaller meso-carnivores are not included. Every habitat type but the AZ upland/Desert Scrub had all five of the predators. Mountain lions, gray foxes, and black bears were the most common in the Madrean Evergreen Woodland. Coyotes and bobcats were the most common in the Semi Desert Grassland. The Semi Desert Grassland cameras are located closer to human development and it appears the more human adapted predators are more common there. Perhaps the lack of competition from larger predators like mountain lions and bears helps promotes this.

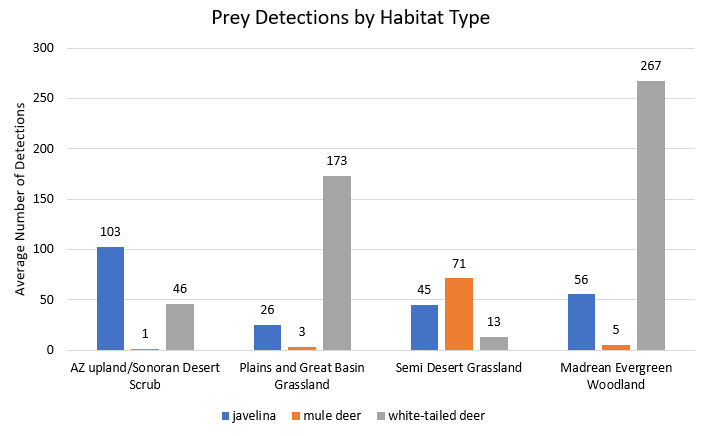
Figure 4 Average number of prey detections by habitat type.
To complement the predator graph above, this graph shows the average number of detections large prey species in the region. Javelina and the two deer species are the favored prey of mountain lions and jaguars, as well as black bears and coyotes. All three prey species were detected at all the habitat types, however at different amounts. It is known that mule deer inhabit lower, dryer habitats and the higher number of detections in the Semi Desert Grassland seems to support this. Additionally, white-tailed deer are known to inhabit the higher elevations which lines up with the high number of detections in the Madrean Evergreen Woodland and Grasslands. Javelina were most common in the AZ upland/Desert Scrub.


Please expect a full report covering each camera in the coming weeks.
Below is a PDF example of a single camera’s analysis: