Our Border Wildlife Study seeks to understand which species live and move across the border between southern Arizona and northern Sonora. Almost five years into the study, we now have a detailed view of how the wildlife community is distributed across 100 miles of this border and to what extent species are able to traverse different barriers. As our cameras continue taking photographs 24/7, the number of species we document grows. We’re also seeing trends for when and where wildlife show up across the seasons. Read on to learn more. The results below cover our first five years and were recently published in the journal Frontiers in Ecology and Evolution. As we get more data, results will continue to be updated moving forward.
- Border Wildlife Study Home
- Study Design
- Project Results
- Volunteer
- Support Our Research
Border Connectivity
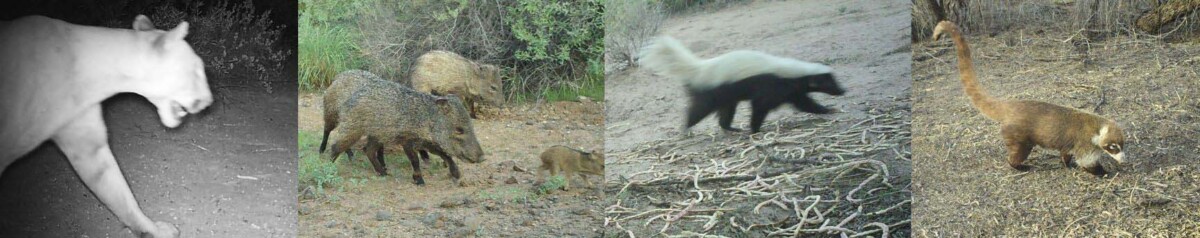
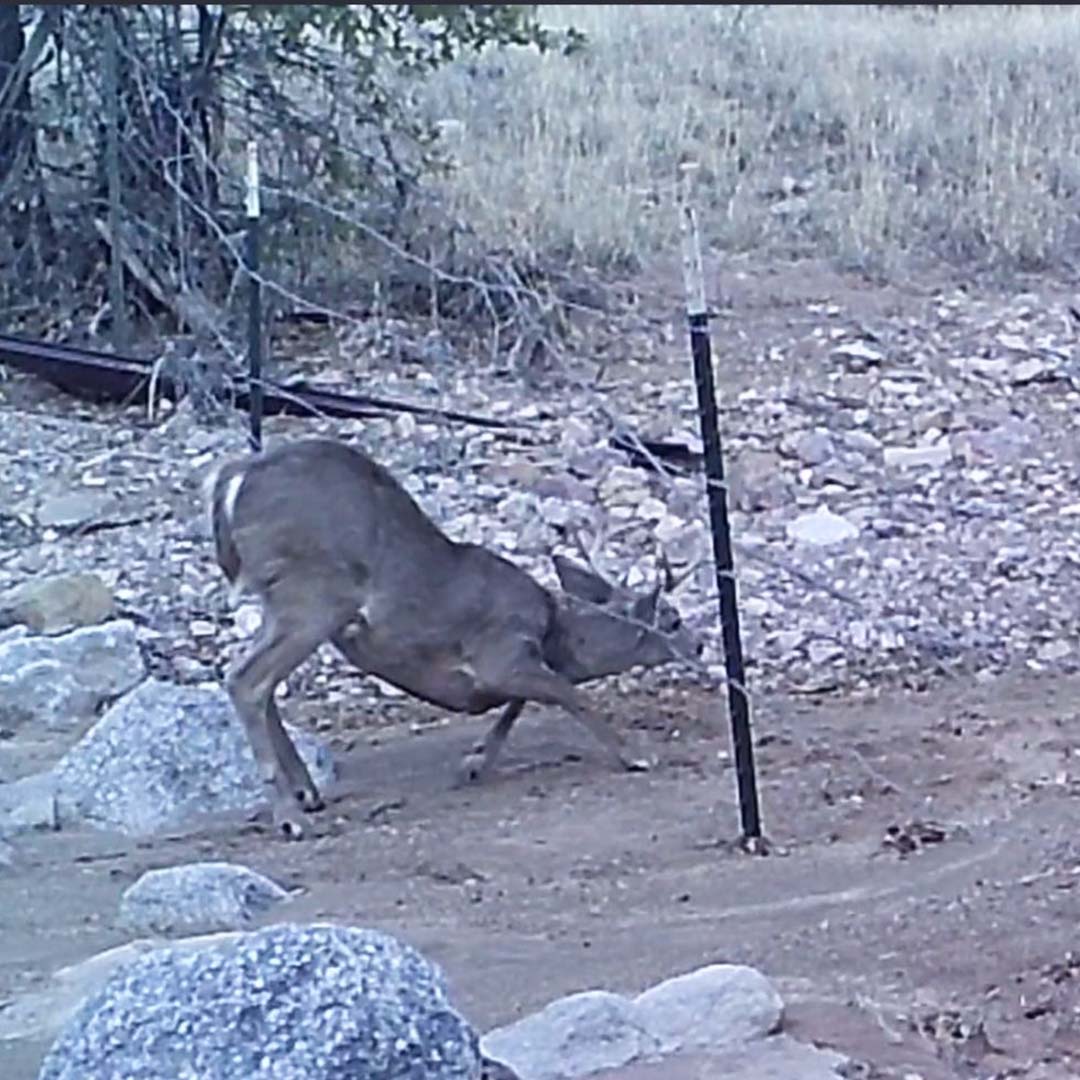
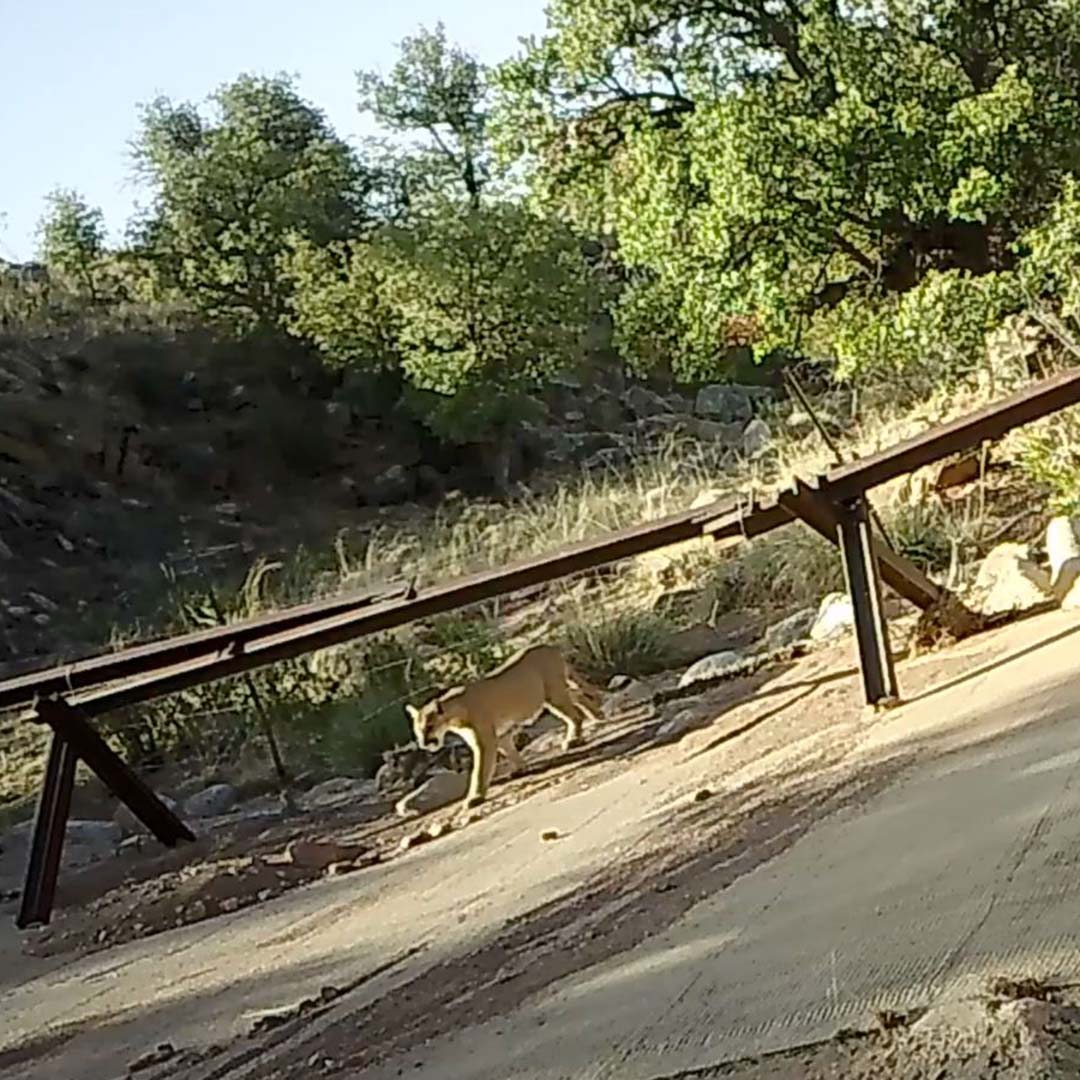
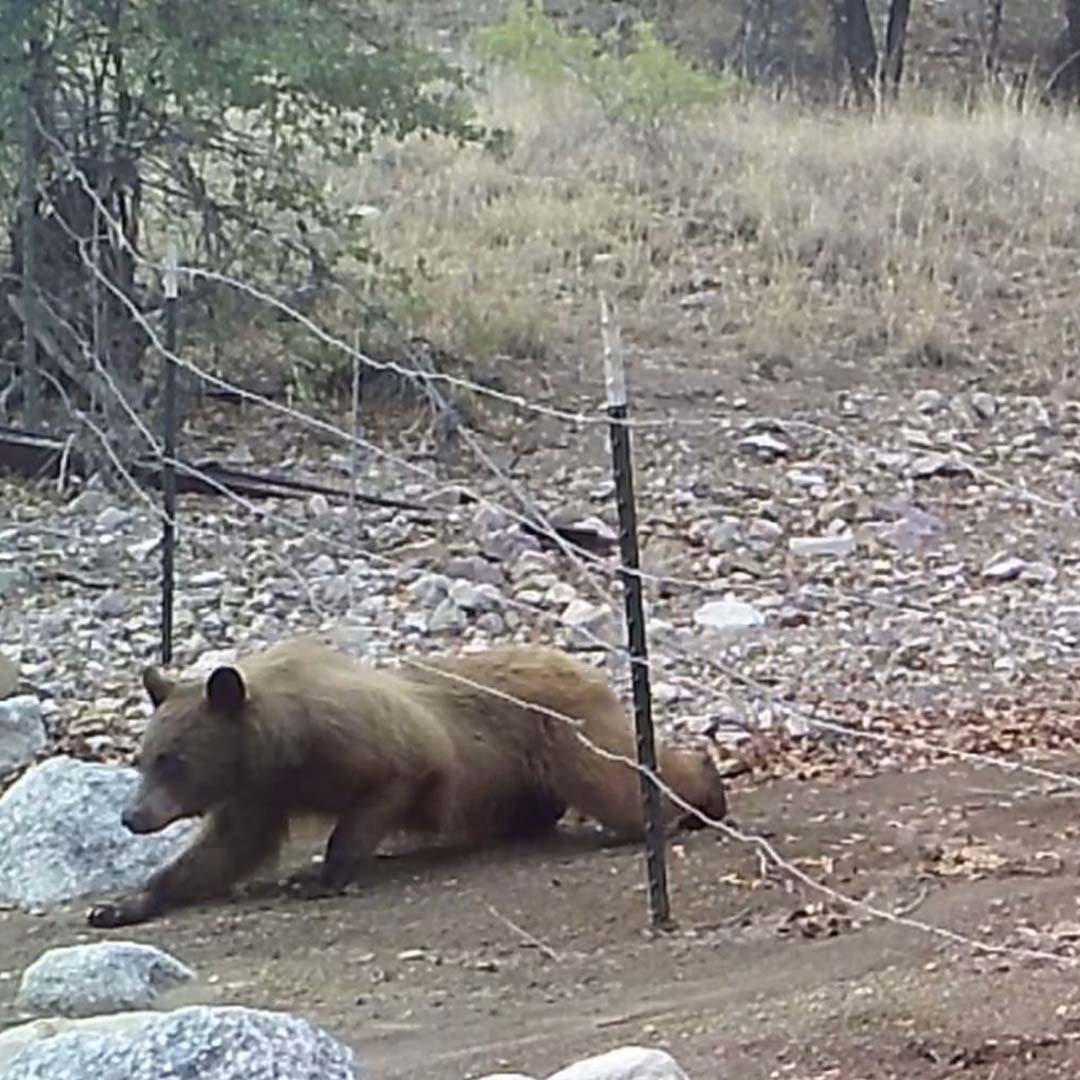
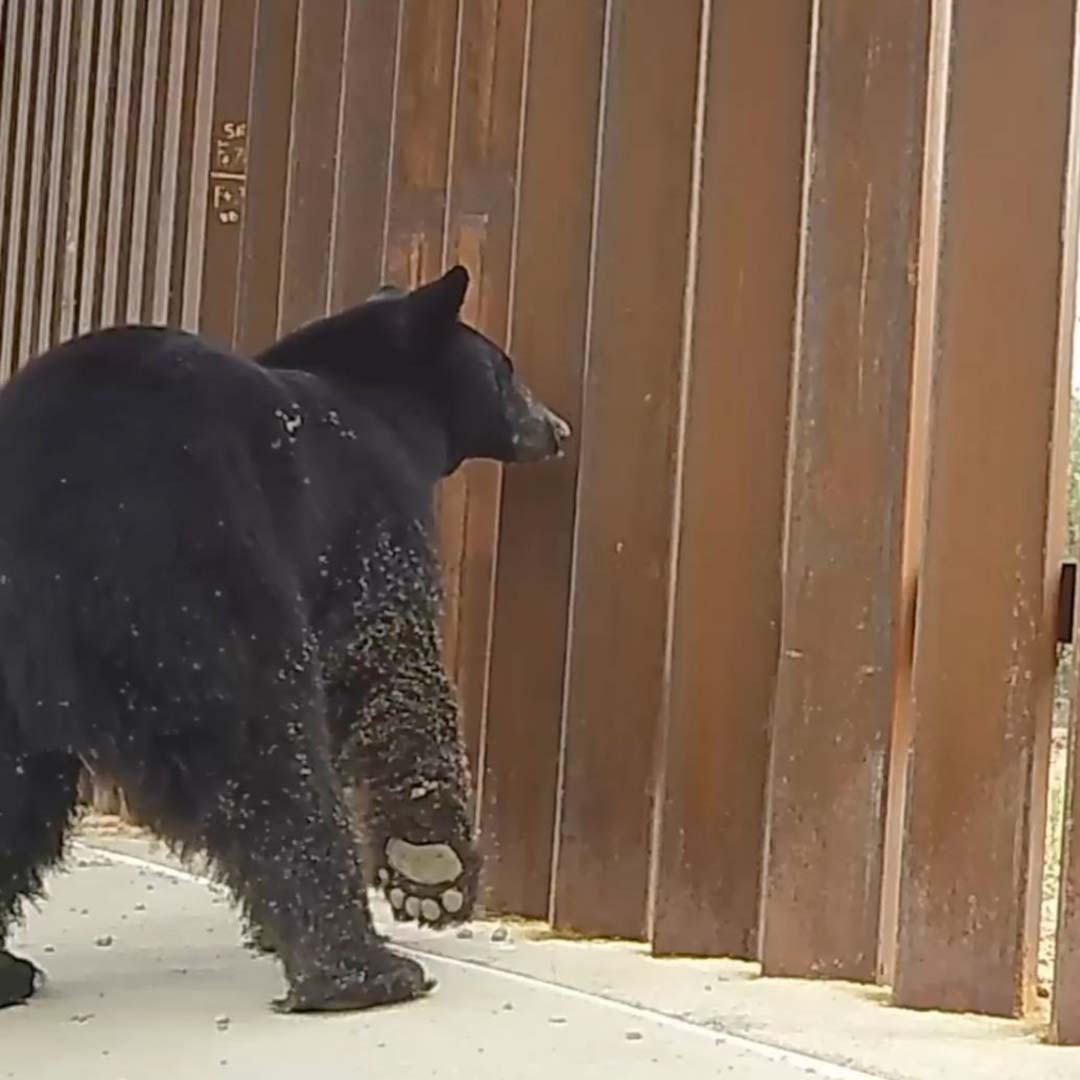
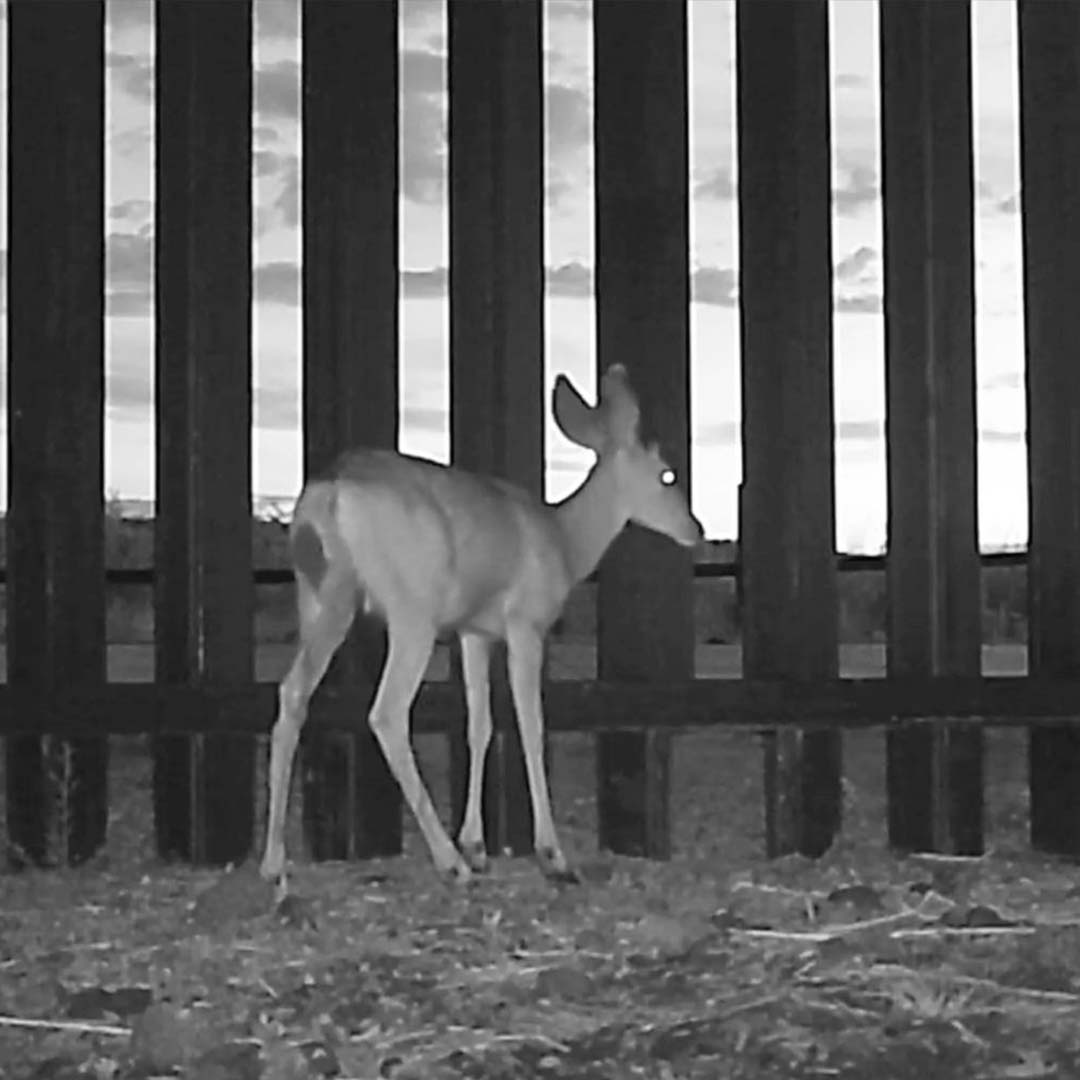
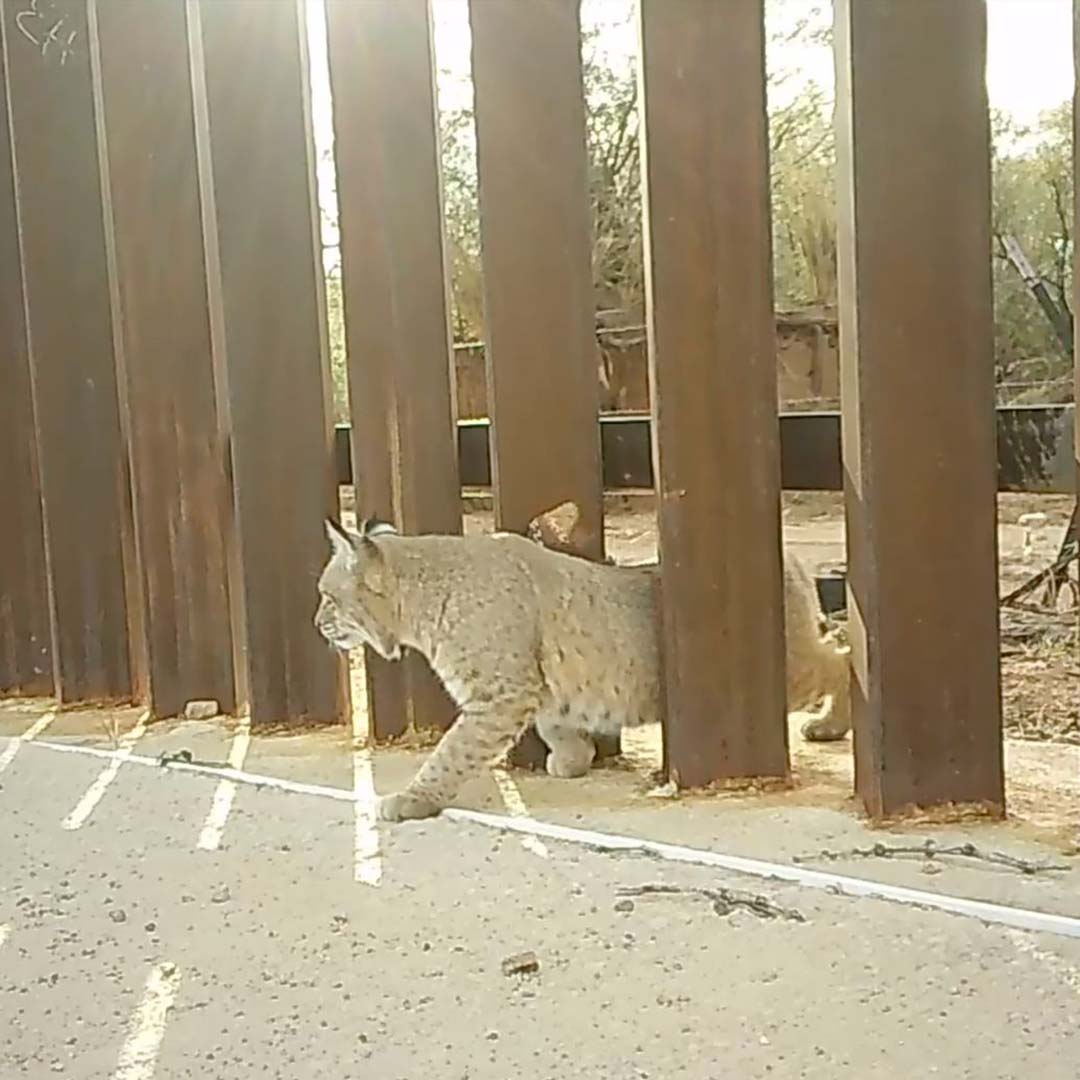
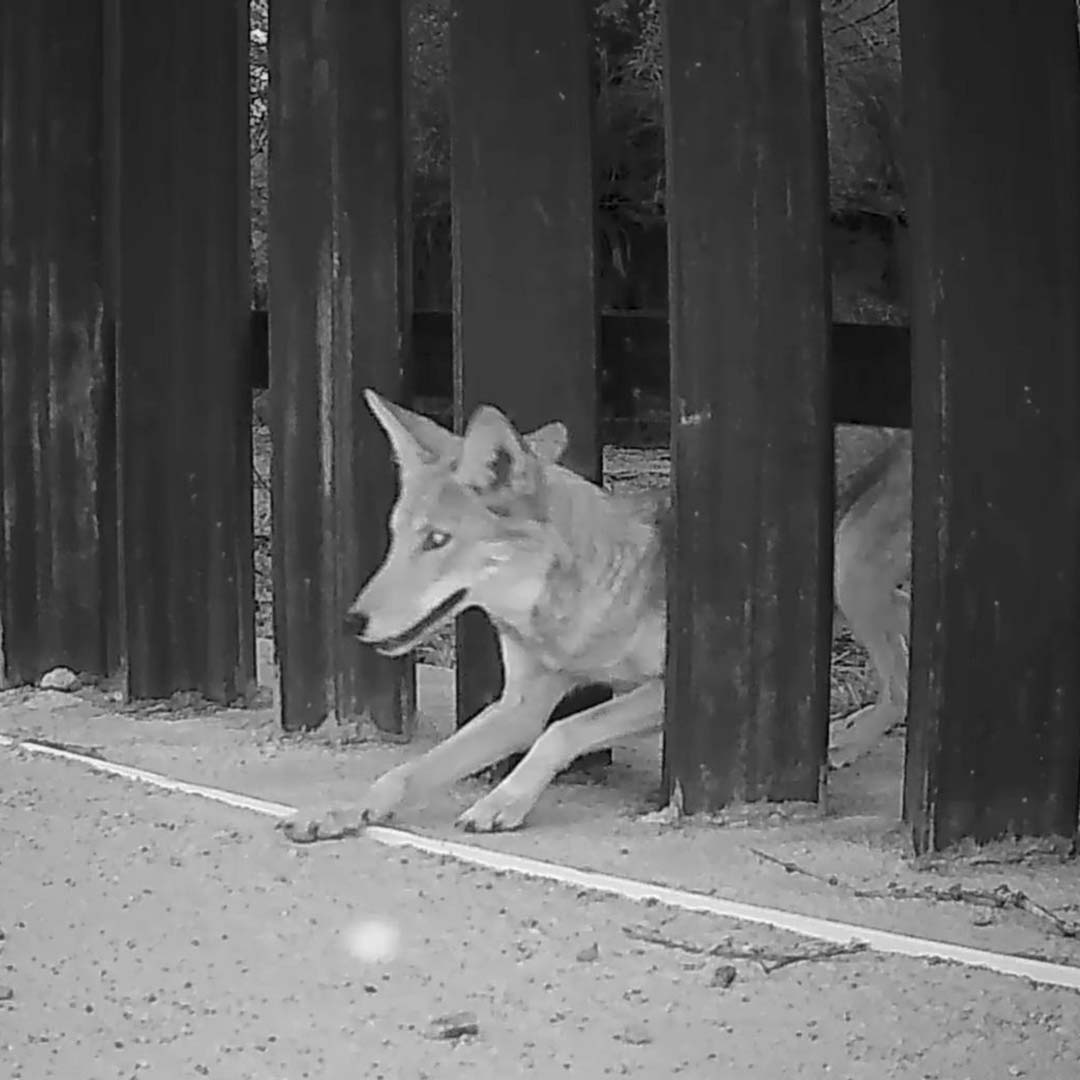
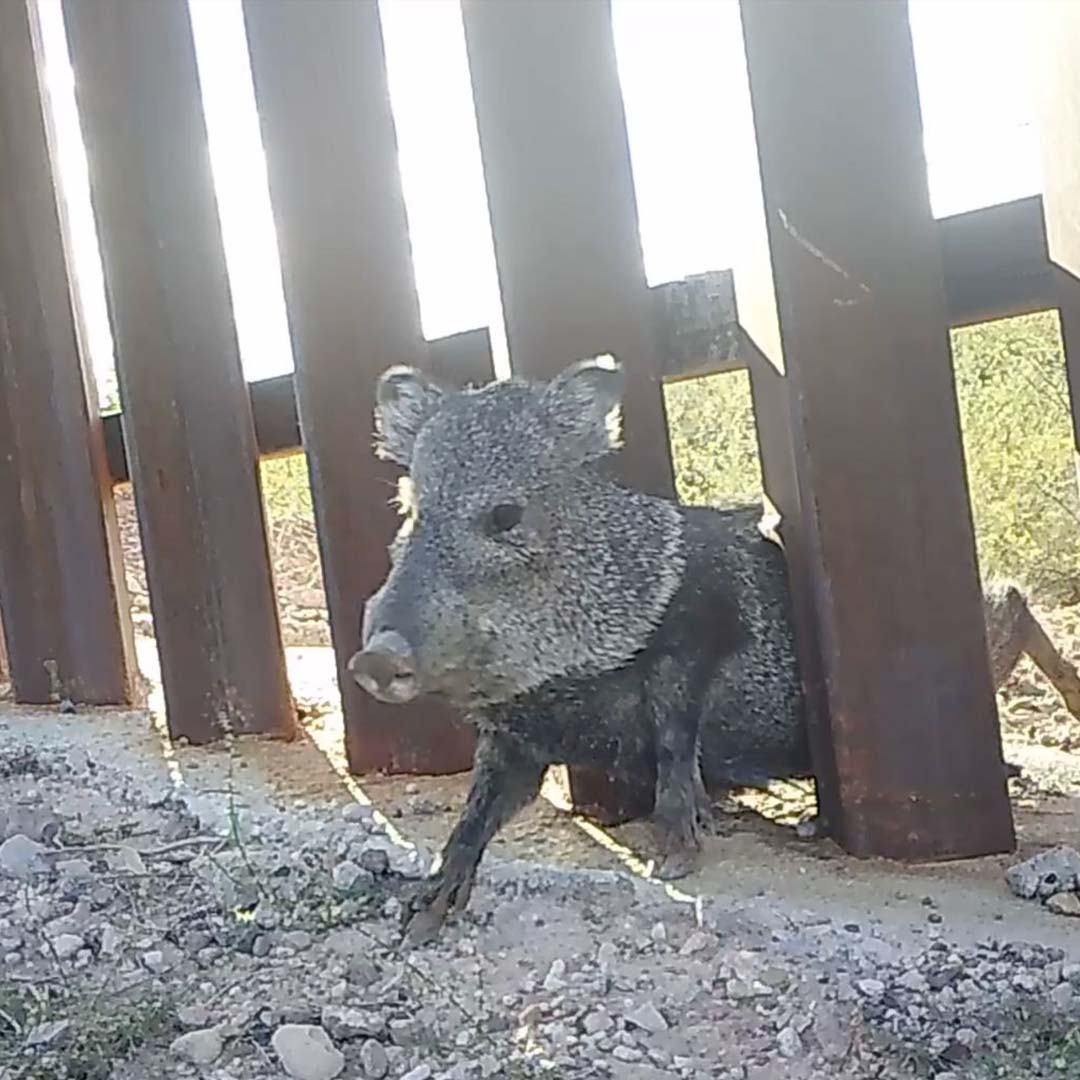
Our Border Wildlife Study provides us with a wealth of information. For example, as you can see in the figure and photos below, we can evaluate the ability of various wildlife species to traverse different border barriers. In our study area, most terrestrial mammals can cross through vehicle barriers, especially where they cross arroyos or washes. However, most species larger than bobcats are unable to cross through border walls, characterized by steel bollards with just four inches between posts. This includes black bears, mountain lions, mule deer, and white-tailed deer. We have observed a few javelinas and coyotes squeeze through border wall, but such crossings are rare.
Small wildlife openings improve crossing rates for bobcats, coyotes, javelinas, and mountain lions, but these openings do not work for larger species like deer and bears. We are unsure if these openings would benefit endangered Mexican gray wolves or jaguars. These species, and many others, will be negatively impacted by border barriers that block their movement corridors.
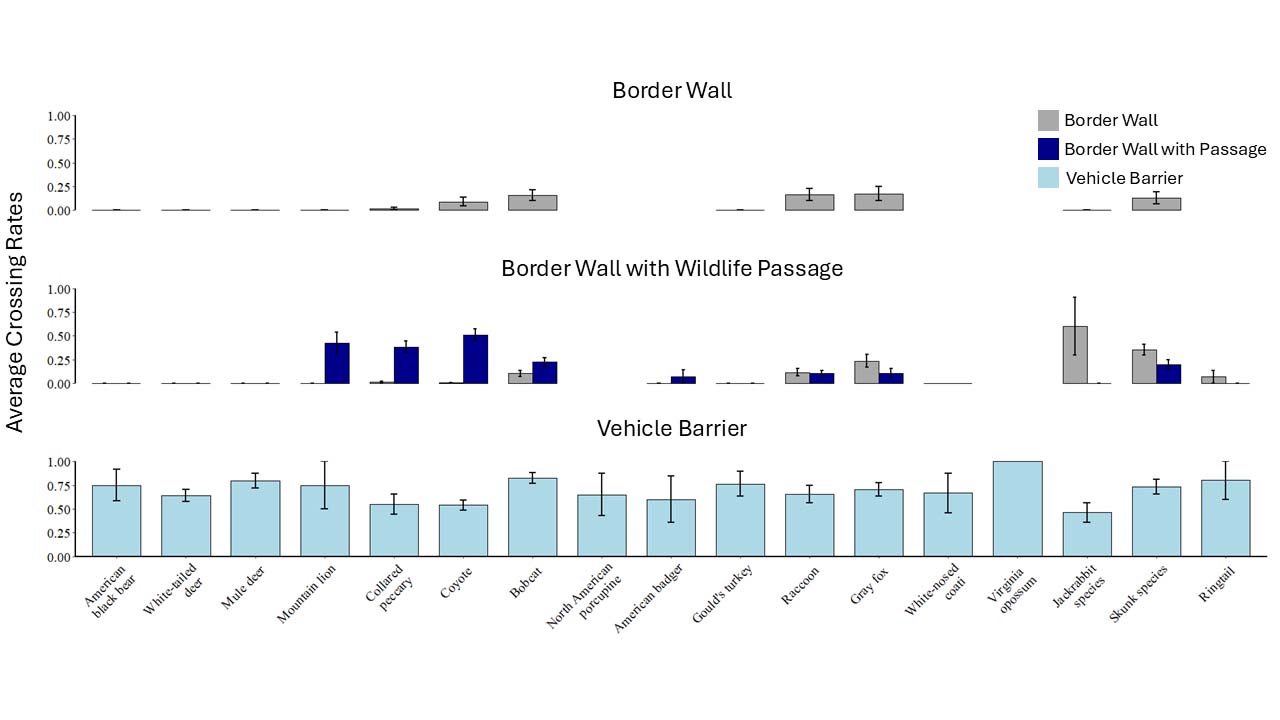
Also, we grouped antelope and black-tailed jackrabbits as “jackrabbit species” and hooded skunks, striped skunks, and hog-nosed skunks as “skunk species” for sample-size considerations. Gaps indicate the species was not observed at the barrier type (e.g., ringtails were not observed on cameras facing border walls without small wildlife passages). For cameras facing small wildlife passages (see row two in the graphic), we further categorized crosses as either through those wildlife passages (blue bar) or through the four-inch spaces that are otherwise typical between border wall bollards (gray bar).
Vehicle Barrier/Barbed Wire — Wildlife Able to Cross
Border Wall Bollards With Small Wildlife Openings — Larger Species Stopped / Unable to Cross
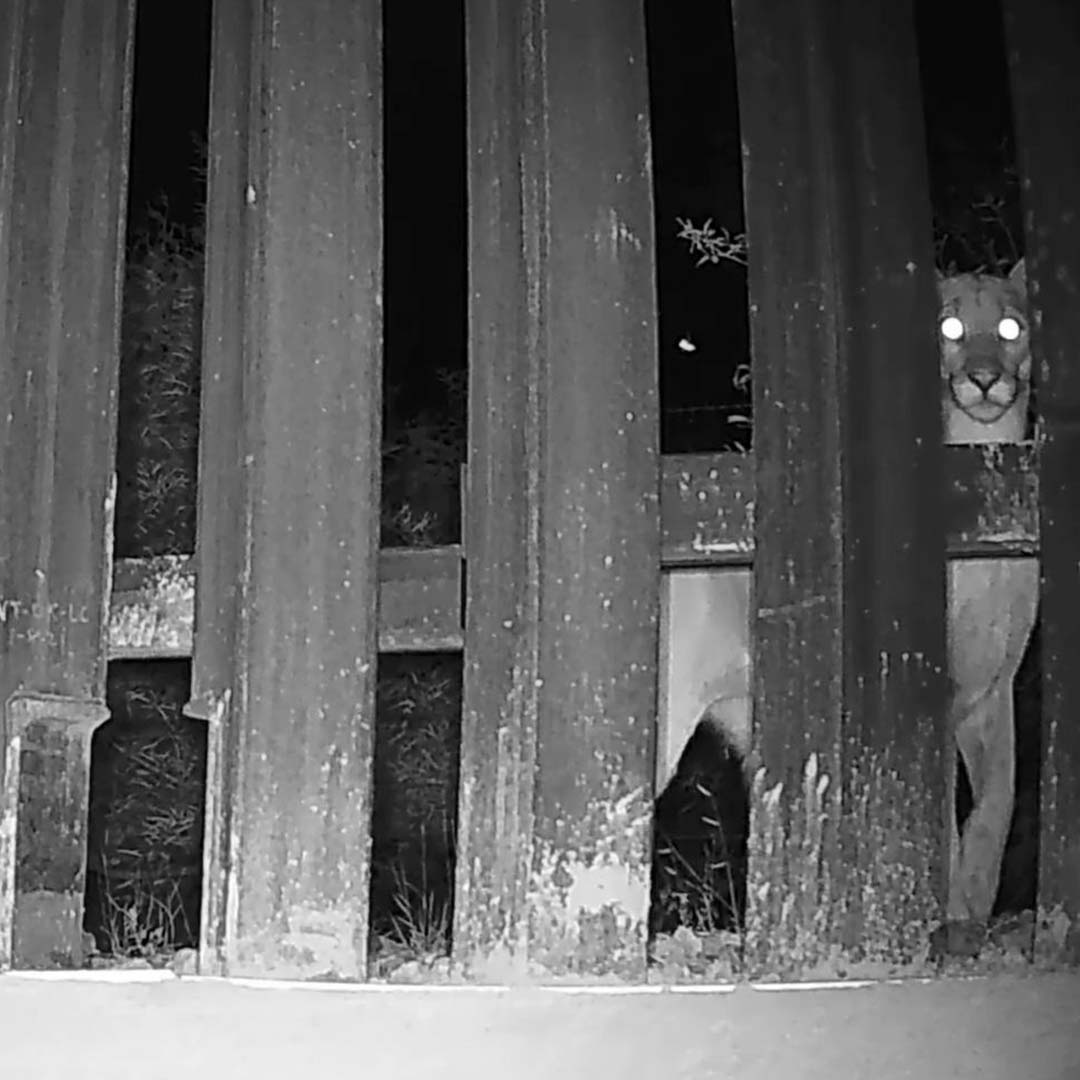
Border Wall Bollards With Small Wildlife Openings — Smallest Species Able to Cross
Community Monitoring
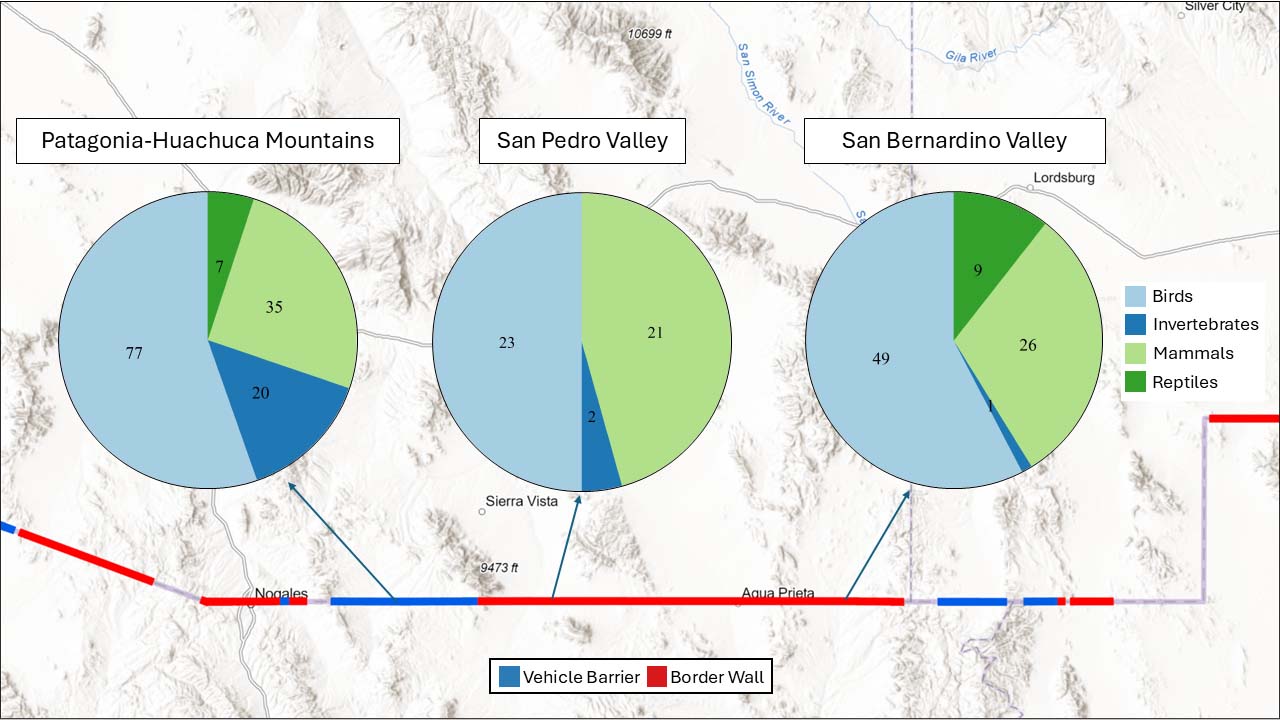
Our Border Wildlife Study seeks to understand which species live and move across the border. The study focuses on terrestrial species readily documented by motion-activated cameras, such as medium-large mammals and wild turkeys. But we also detect other birds, reptiles, invertebrates, cattle, and humans across the study area.
Our species tally includes all animals identified to the species level and animals identified to unique taxonomic groups such as genus or family. Small wildlife are often difficult to identify to species from photos alone, so we identify them to the extent possible. For example, we can identify woodrats (Neotoma spp.) to genus but not to species level from photos. So, we classify all woodrat detections as “Neotoma species” and consider this one unique taxa in our tally, even though the number of woodrat species may be greater.
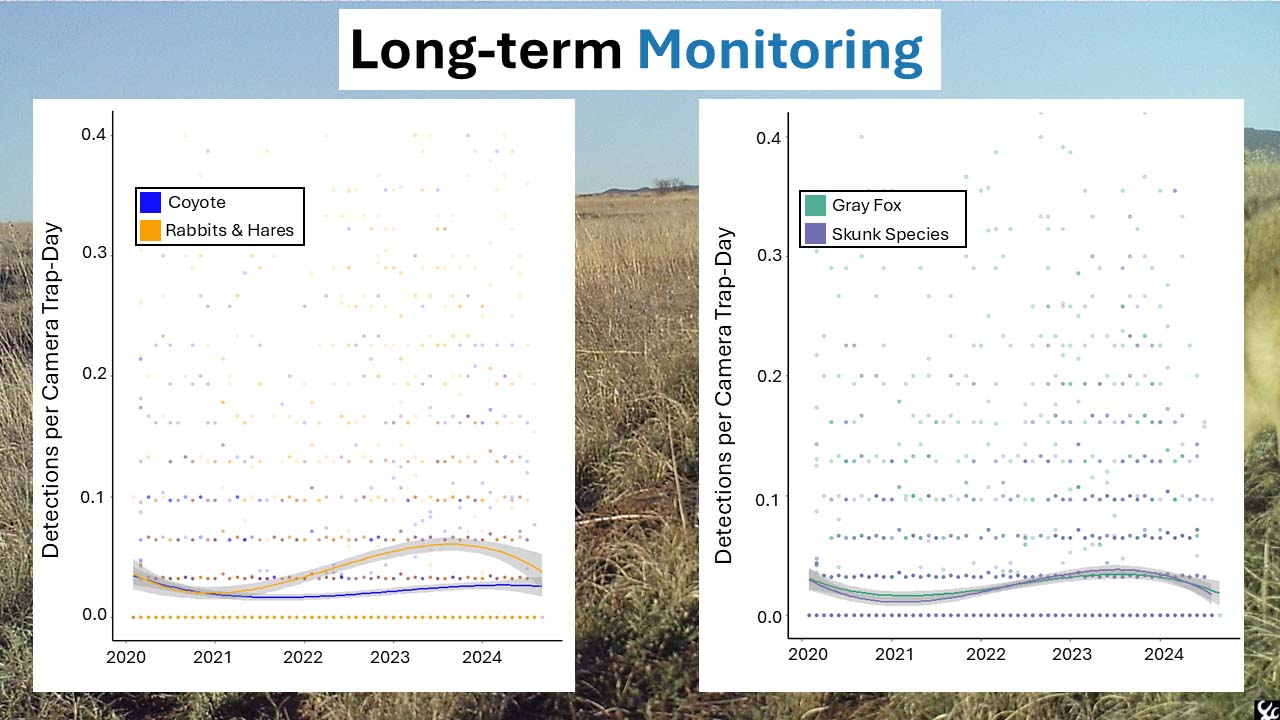
Detection Trends and Patterns
Our cameras have continuously monitored wildlife species for nearly five years, and this gives us the ability to evaluate trends and patterns through time. For example, we have seen fluctuations in the detections of many species, including coyotes and lagomorphs (rabbits and hares), where the number of coyotes appear correlated with the number of lagomorphs. And we’ve seen similar patterns in mesocarnivores, such as gray foxes and skunks (see figure below). Some of the ebbs and flows apparent in the detections may be driven by habitat and climatic conditions. We are continuing to evaluate the mechanisms driving these patterns.